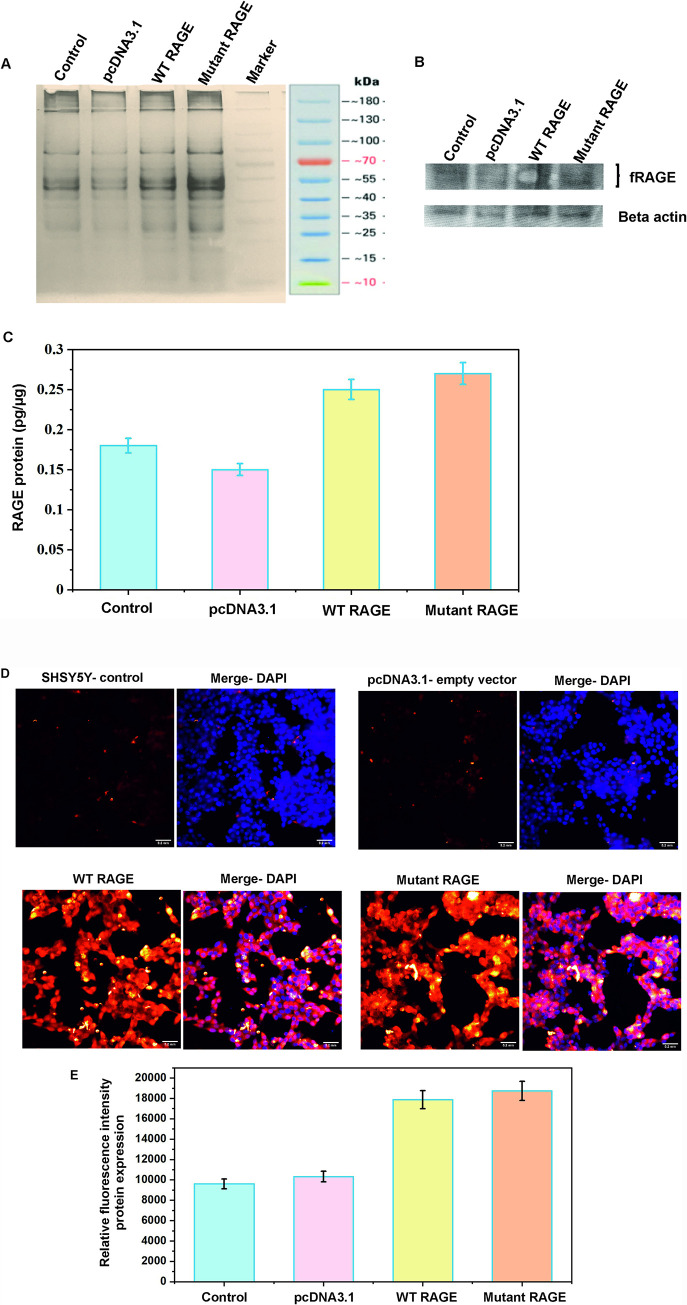
Fig 5. Protein profiling of transfected RAGE cell.
A) SDS PAGE gel with cell lysate. B) Western blot analysis of RAGE in transfected and non-transfected cells. C) Quantification of RAGE expression using ELISA, bar graph depicts the mean RAGE expression level and error bars represents the standard error mean. D) Relative quantification of RAGE expression using fluorescent intensity obtained from fluorescent image of controls and transfected cells. E) Bar graph depicts the mean relative fluorescent intensity with error bars represents the standard error mean for RAGE protein expression. Cells were incubated with Alex Fluor tagged secondary antibody (30 min), DAPI (10min) and imaged. Scale bar correspond to 0.2mm in all images.

