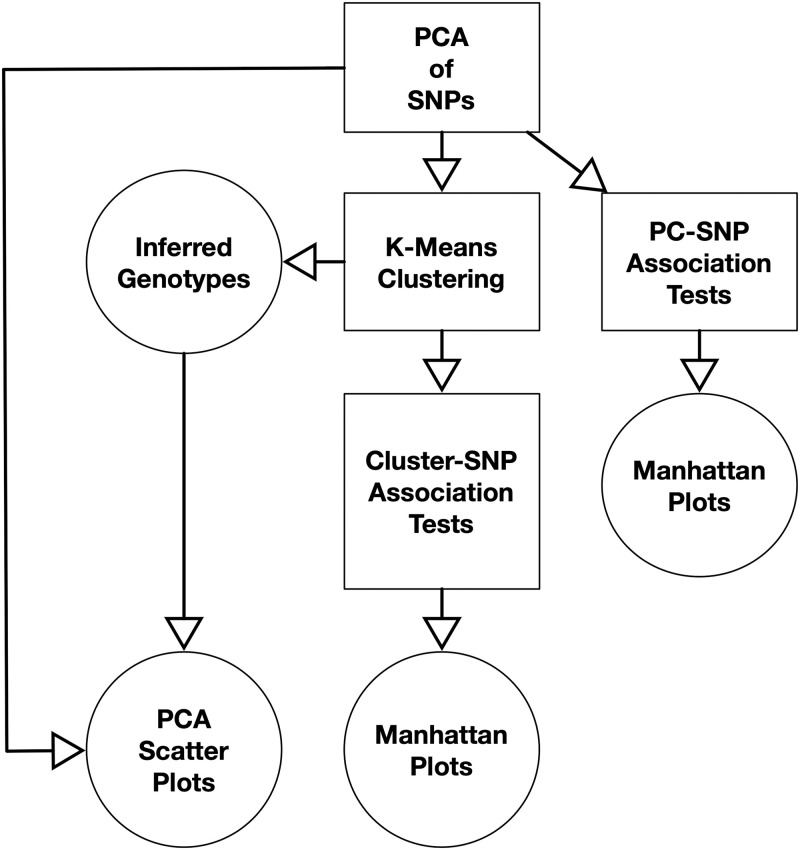
Fig 1. Workflows for detecting, localizing, and genotyping inversions.
The three approaches (PCA with clustering, PC-SNP association testing, and Cluster-SNP association testing) all begin with performing PCA on a feature matrix generated from SNP data. K-Means clustering is performed using the PC coordinates to infer genotypes. The inferred genotypes and PC coordinates of the samples are represented using scatter plots. Association testing can be performed between the samples’ SNP genotypes and either the PC coordinates or cluster labels. The p-values from the association tests are plotted along the chromosome in a Manhattan plot to visualize the spatial distribution of the associations and detect and localize inversions.

