Graph 2.

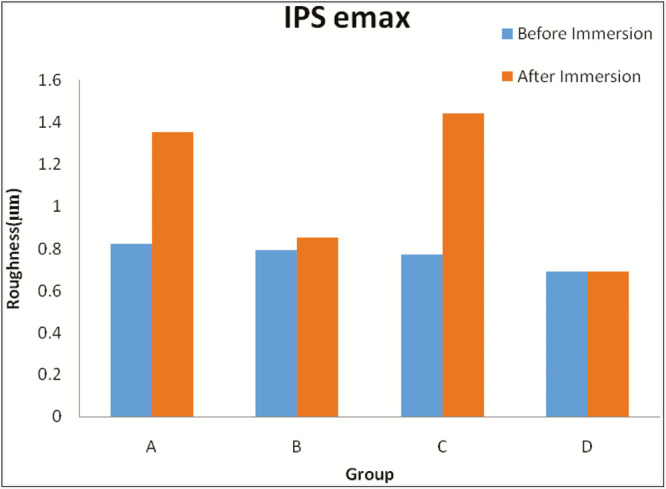
Comparison of roughness value of IPS e.max Ceram between the groups before and after immersion in each solution (in µm). Group A = Coca-Cola, Group B = chlorhexidine mouthwash, Group C = simulated vomit solution, Group D = distilled water

Comparison of roughness value of IPS e.max Ceram between the groups before and after immersion in each solution (in µm). Group A = Coca-Cola, Group B = chlorhexidine mouthwash, Group C = simulated vomit solution, Group D = distilled water