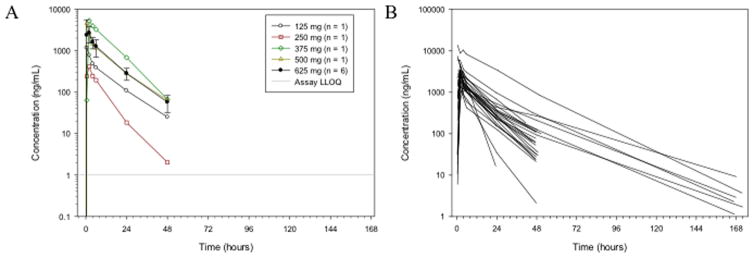
Figure 1. ONC201 plasma concentrations following the first dose of ONC201.
Concentrations are shown as (A) the mean for each dose cohort in dose escalation, or (B) for all individuals treated at 625 mg. Data points below the limit of detection (1ng/mL) are excluded from the plots. Error bars indicate standard deviation.

