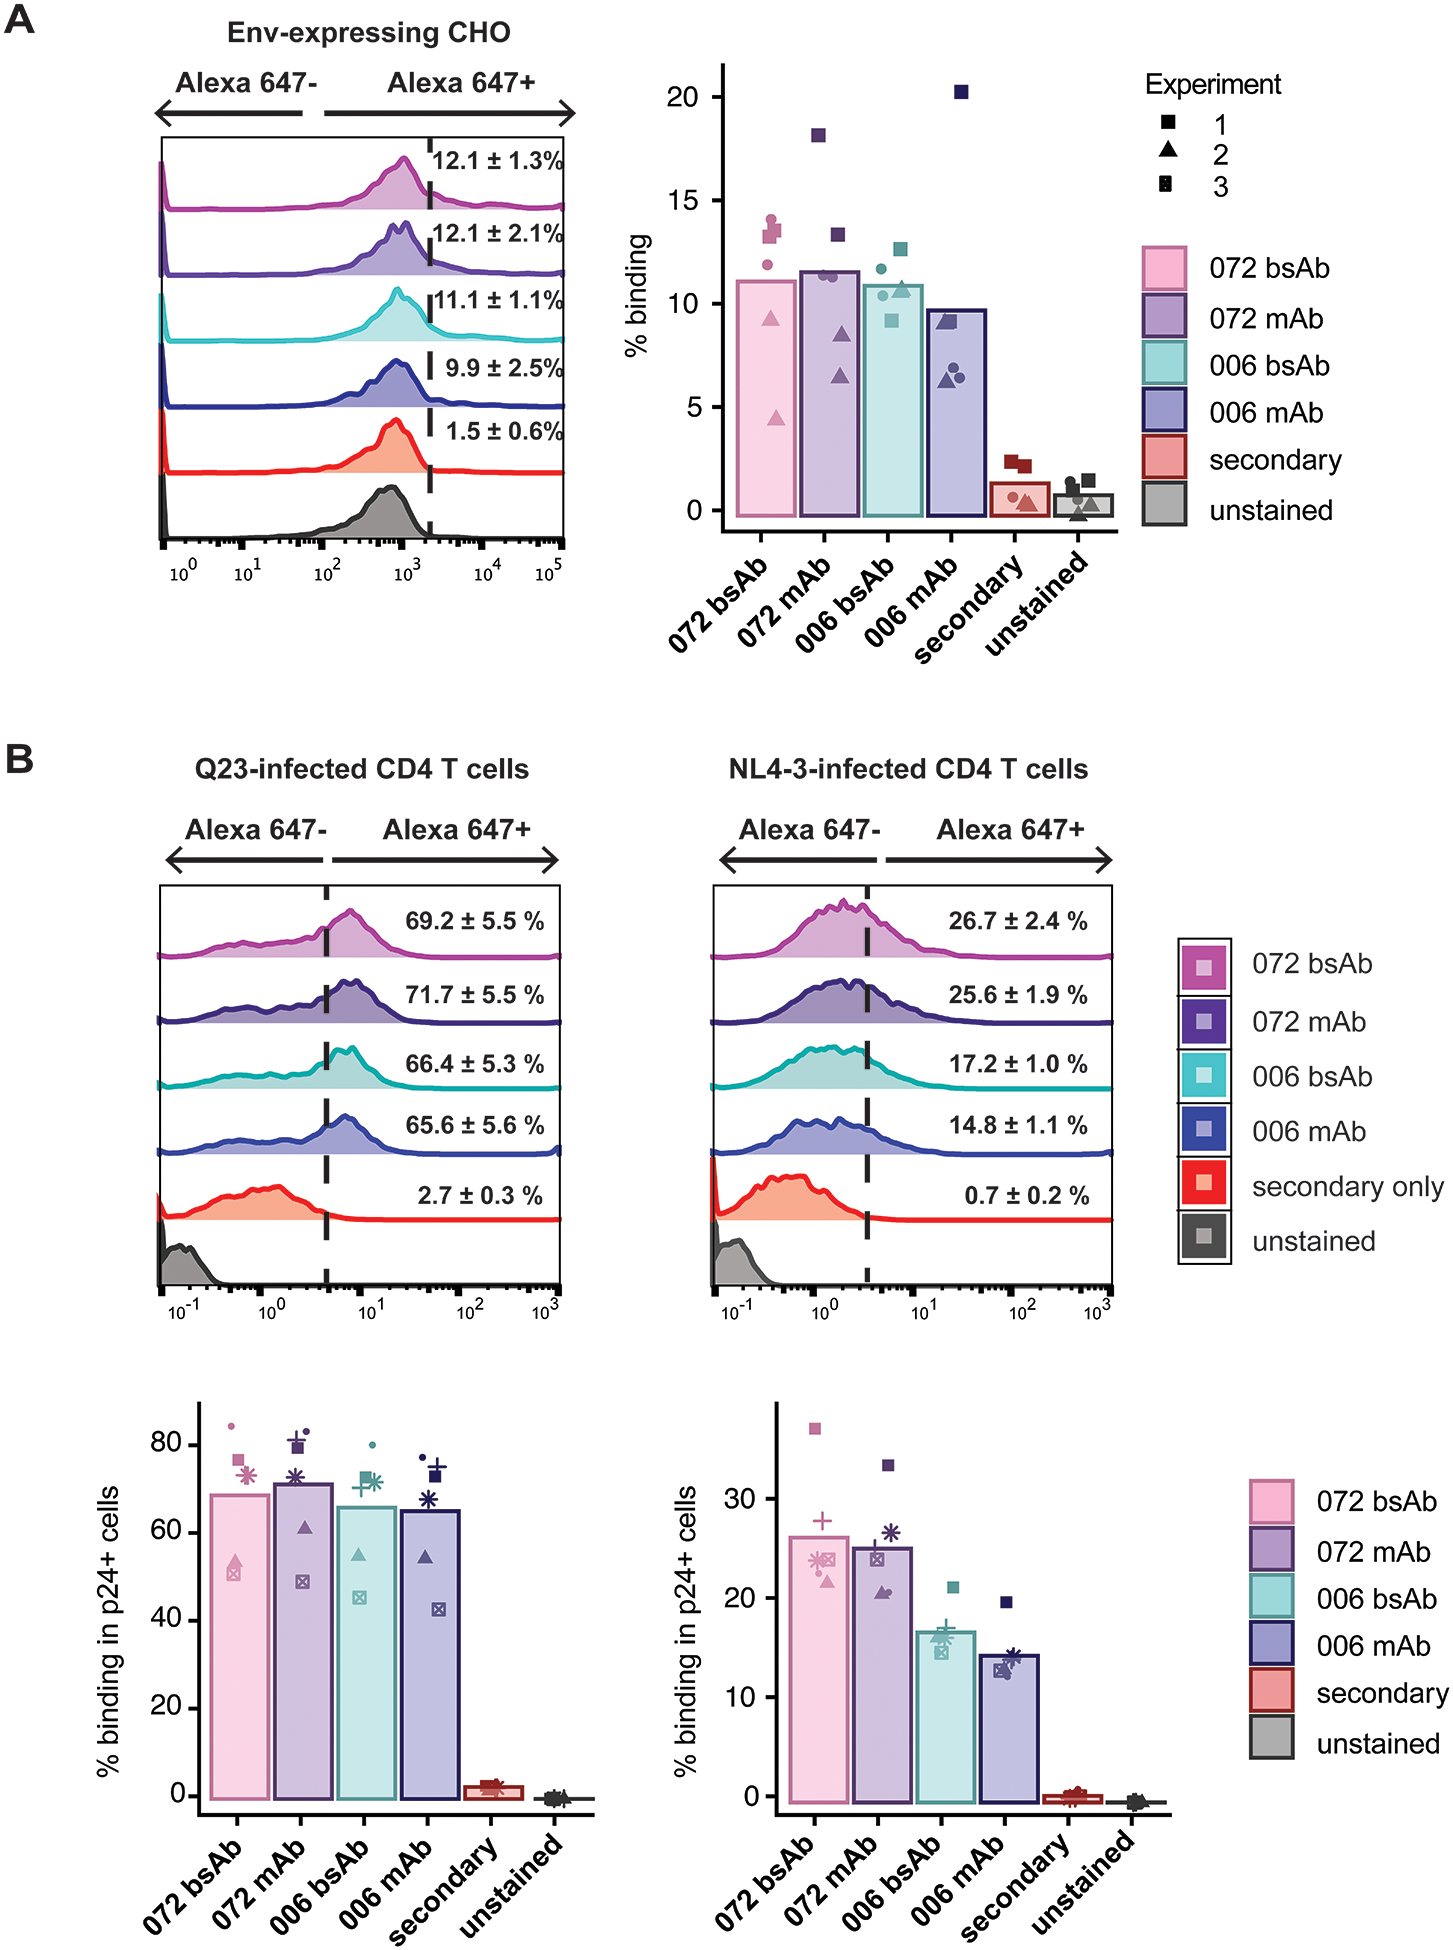
Figure 3.

Binding of antibodies (bsAbs and mAbs) to (A) CHO-WT cells expressing Env and (B) primary CD4 T cells infected in vitro with either a clone from early subtype A HIV infection (Q23) or lab-adapted (NL4–3) strain of HIV. For each, histograms of antibody binding are shown for one representative repeat; the dotted line indicates the gate set based on the secondary only stained control. Mean percentage positive binding and corresponding SEM are shown numerically for each antibody. In the bar graph, percentage positive binding of each antibody is shown for each of (A) 3 separate biological repeats, each with 2 replicates and (B) 6 biological replicates, and mean values for each antibody are shown in the overlaid bar graph. Shapes denote individual biological replicates.
