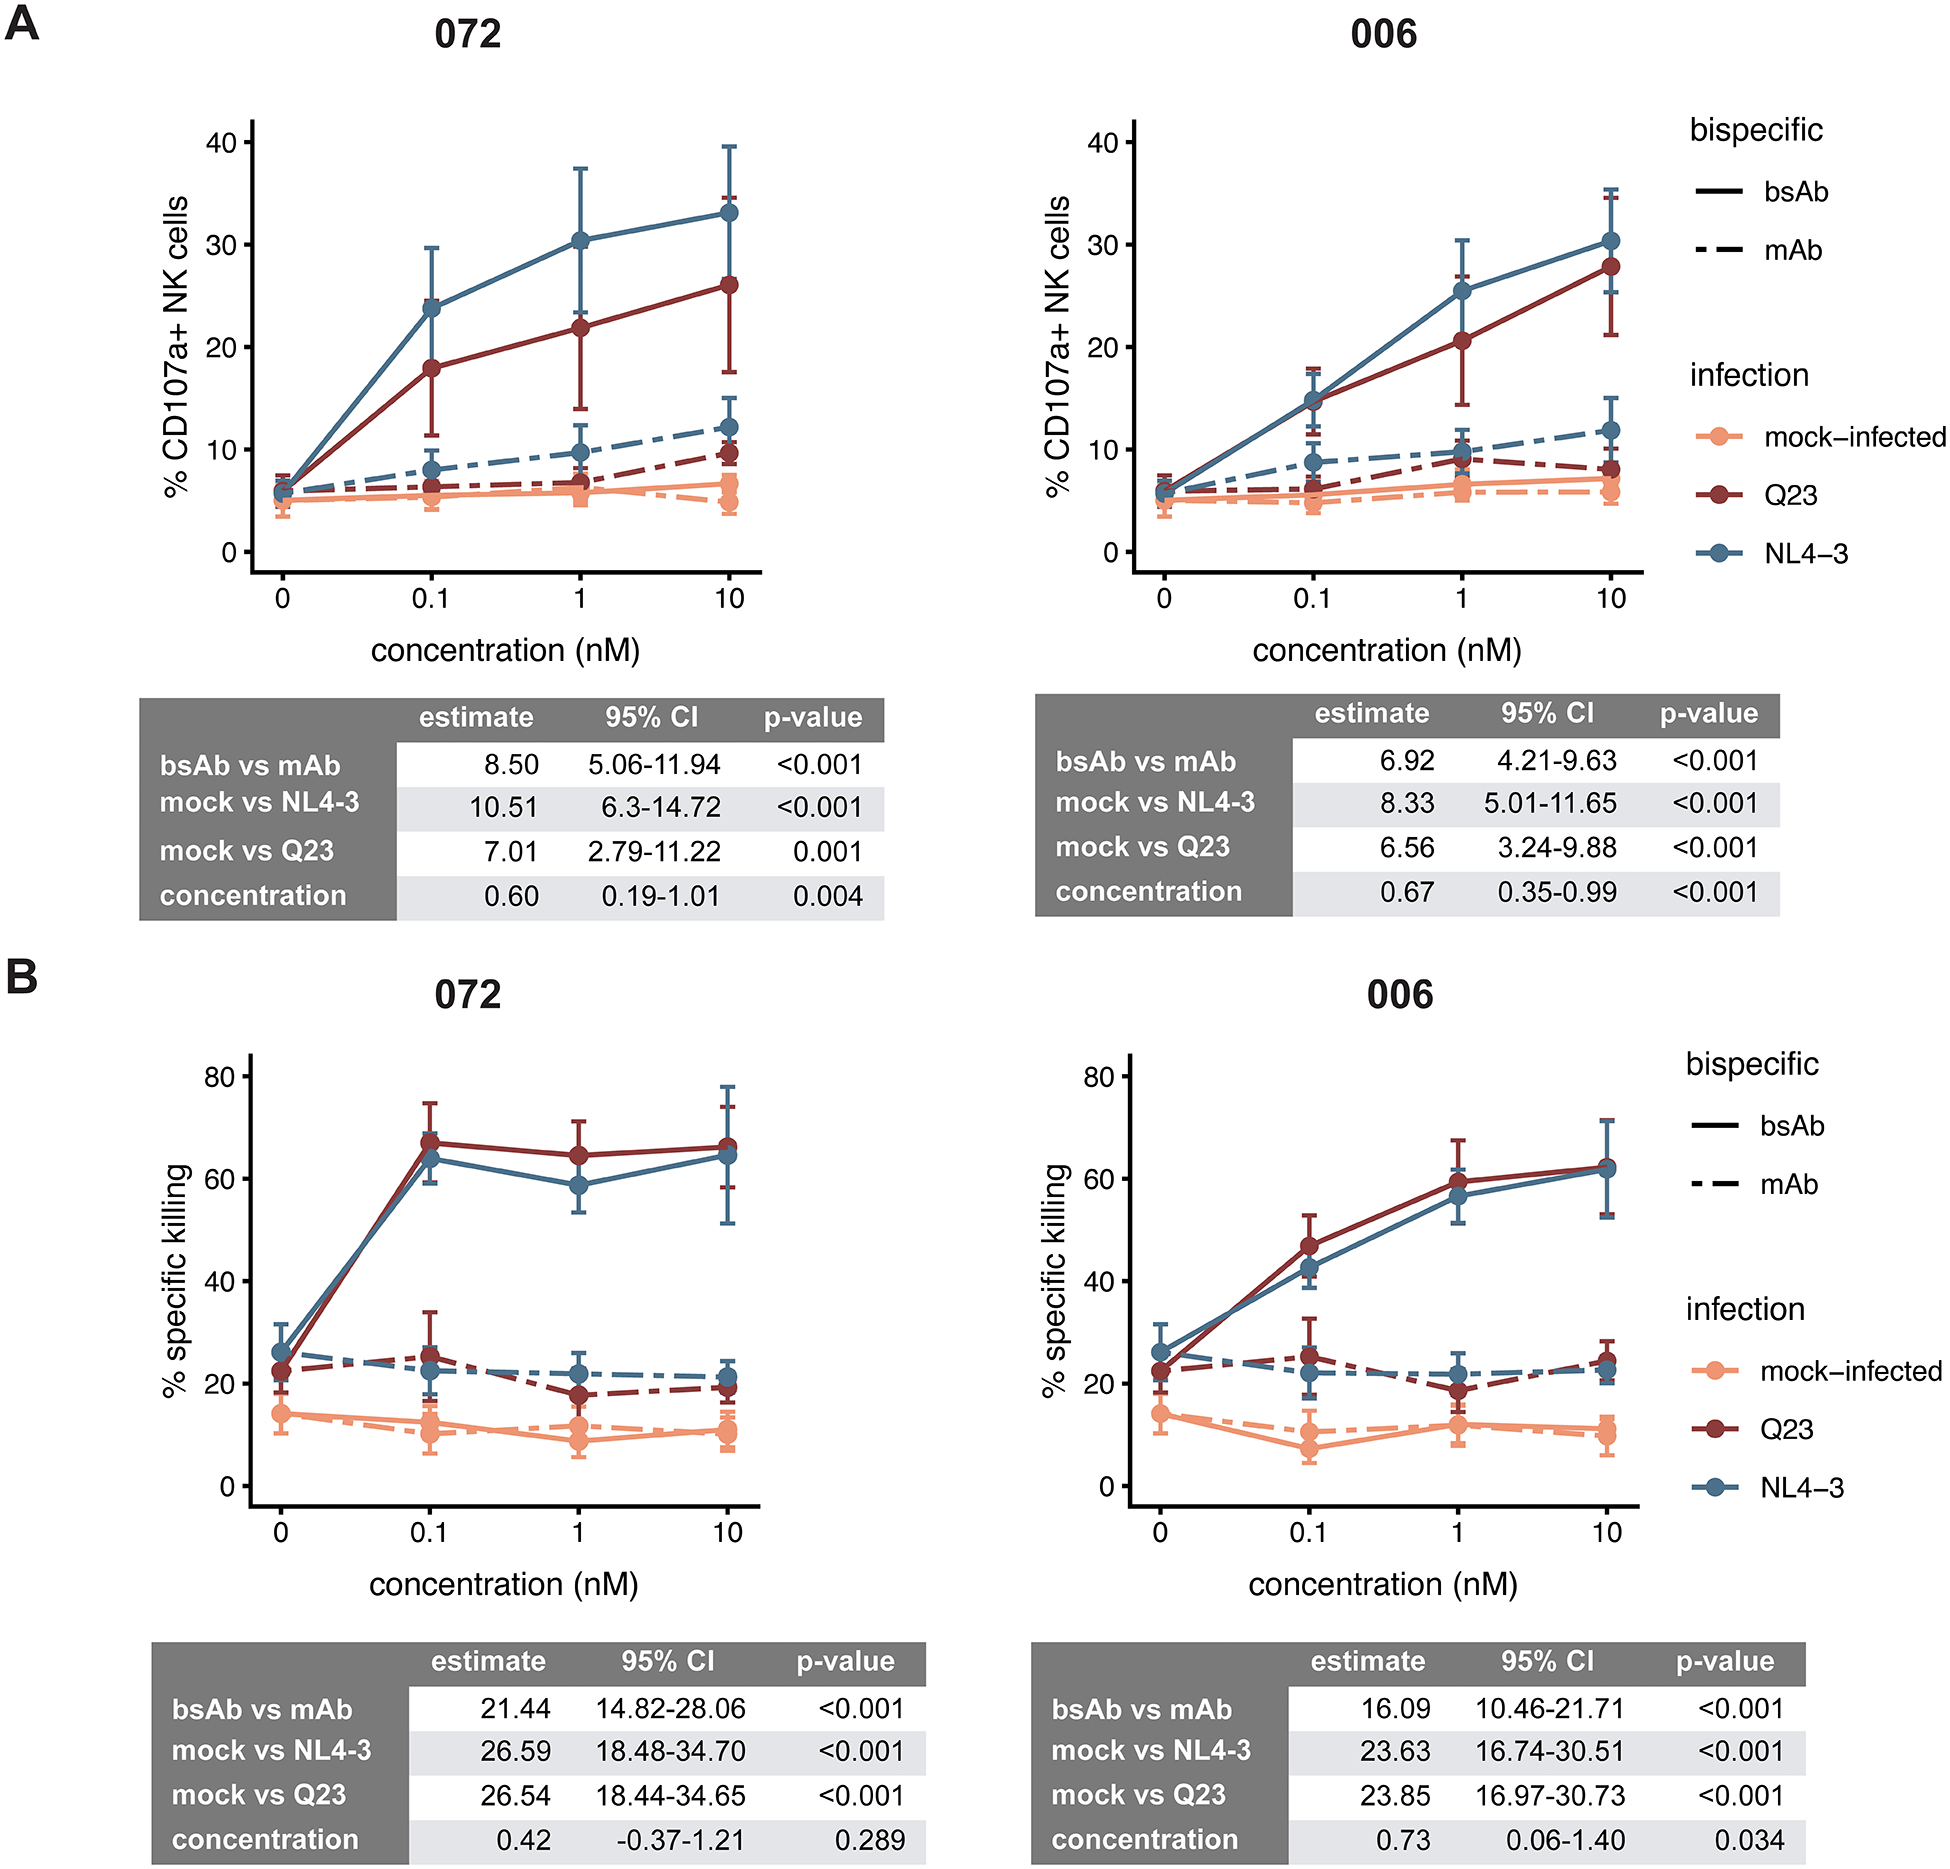
Figure 4.

NK cell responses to autologous primary CD4 T cells that were mock-infected (orange) or infected with either an early subtype A clone (Q23, red) or a lab-adapted, subtype B strain (NL4–3, blue) of HIV, in the presence of varying concentrations of the bsAbs/mAbs, were assessed by (A) degranulation of NK cells as measured by % positive for CD107a by FACS, and (B) killing, as detected by calcein release. The data represents the mean and SEM for 6 (A) and 4 (B) donors respectively. Estimates for the contribution of each of the factors tested to % CD107a+ (A) or % specific killing (B) in the linear mixed model are shown in the table below each figure, together with 95% confidence intervals and p-value.
