Figure 7.

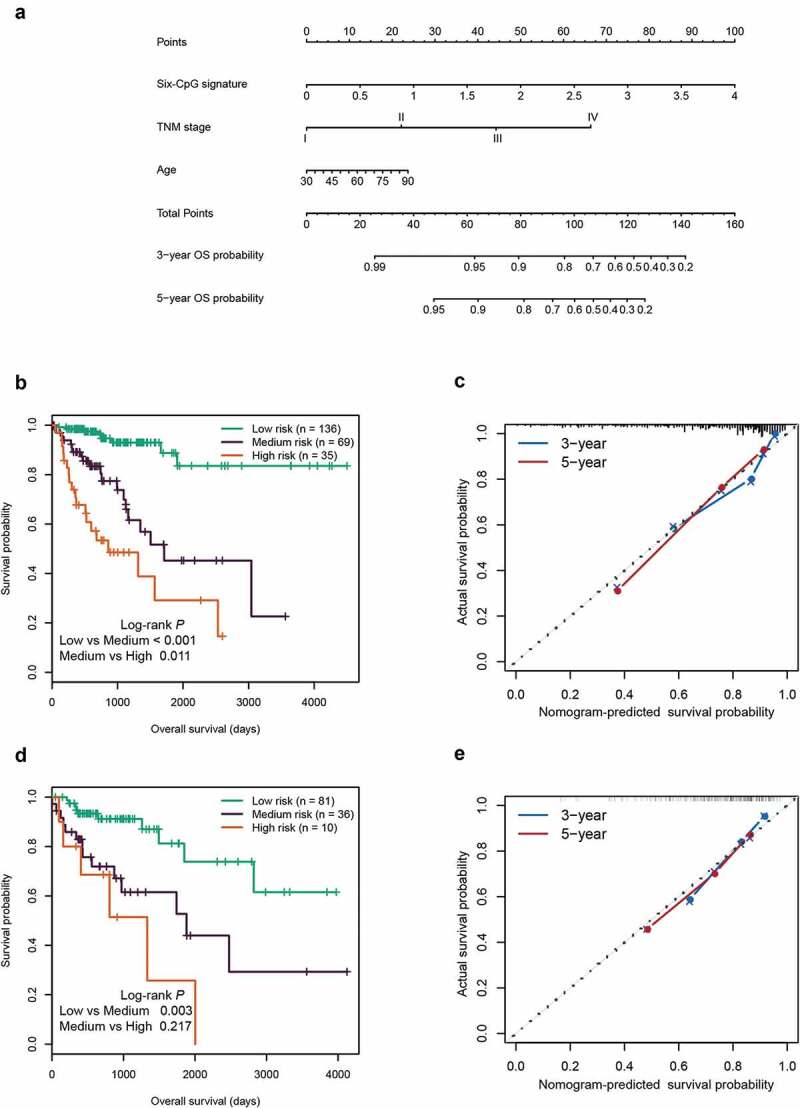
Construction and validation of the prognostic nomogram. (a) Nomogram for predicting the 3-year and 5-year OS of patients with CRC. Kaplan‐Meier curves of three subgroups stratified by the total points of the nomogram in training cohort (b) and test cohort (d). The calibration curves for predicting the 3-year and 5-year OS in the training cohort (c) and test cohort (e)
