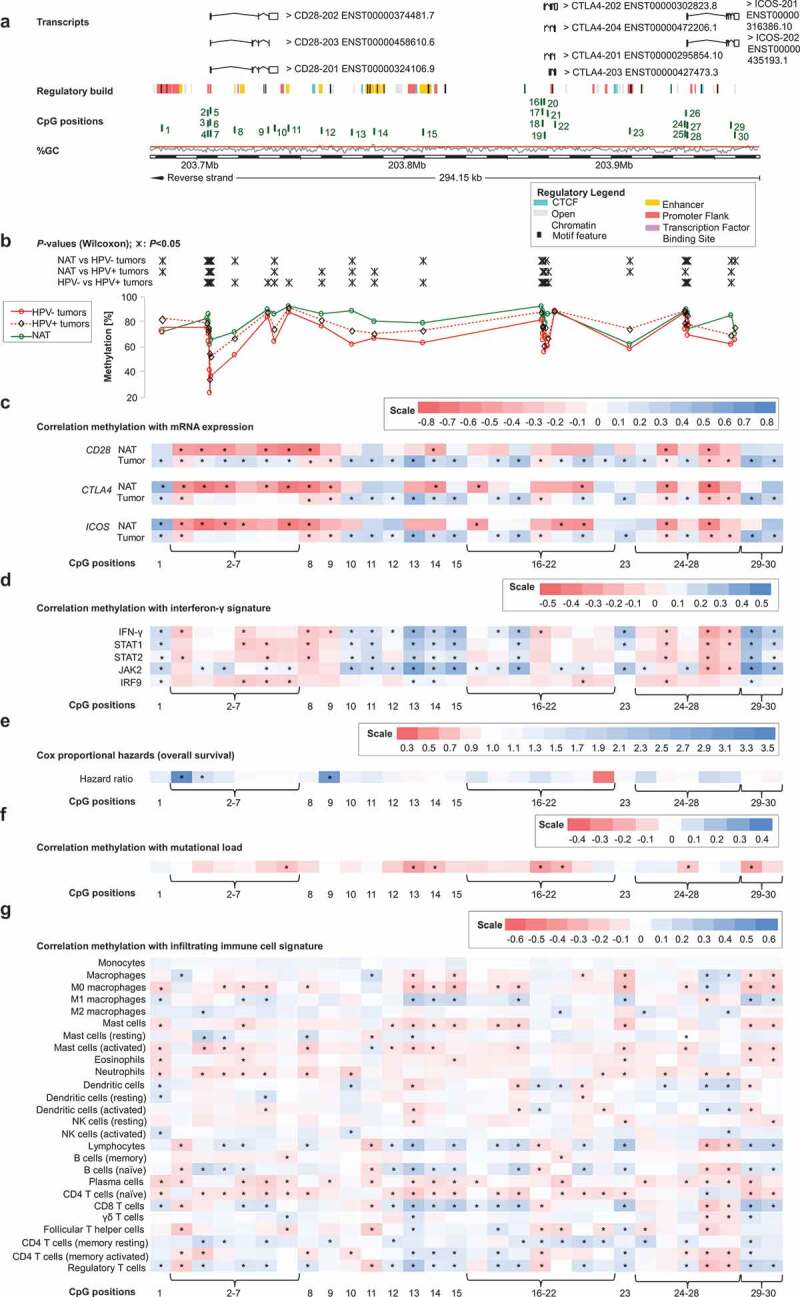
Figure 1.

Genomic organization of CD28, CTLA4, and ICOS (a); CD28, CTLA4, and ICOS methylation in normal adjacent and tumour tissues (b); correlations with mRNA expression (c), interferon-γ signature (d), overall survival (e), mutational load (f), and tumour infiltrating immune cells (g). a) Shown are CG-density and 30 target sites of HumanMethylation450 BeadChip beads. CD28: CpGs 1–14 (1 intergenic region, 2–7 central promoter, 8–10 gene body, 11–14 intergenic region); CTLA4: CpGs 15–23 (15 intergenic region, 16–18 promoter flank, 19–21 central promoter, 22 gene body, 23 intergenic region); ICOS: CpGs 24–30 (24–25 promoter flank, 26–28 central promoter, 29–30 gene body). b) Shown are methylation levels within the 30 targeted CpG loci within CD28, CTLA4, and ICOS in normal adjacent tissue (NAT), HPV+ and HPV– tumour tissue. c) Shown are Spearman’s ρ between CD28, CTLA4, and ICOS methylation and CD28, CTLA-4, and ICOS mRNA expression and D) with interferon-γ signature. e) Cox proportional hazards with regard to CD28, CTLA4, and ICOS methylation. f) Correlations between CD28, CTLA4, and ICOS methylation and mutational load. g) Correlations between CD28, CTLA4, and ICOS methylation and signatures of tumour infiltrating leukocytes. Statistically significant features are marked with asterisks. P-values refer to Wilcoxon-Mann-Whitney U test for comparisons, to Spearman’s ρ for correlations, and Wald test for Cox proportional hazard analysis, respectively
