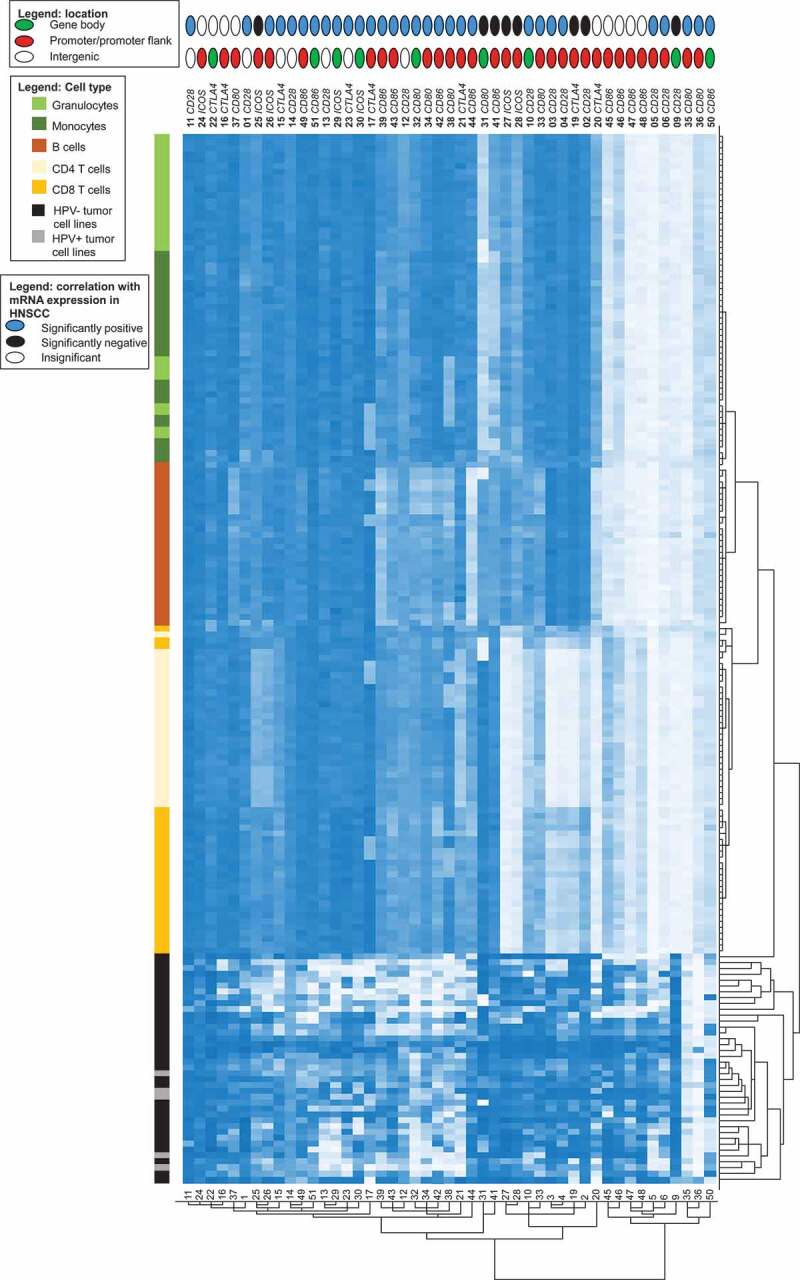
Figure 5.

Cluster analysis of methylation in HNSCC cell lines and isolated leukocytes. Methylation levels of isolated leukocytes (N = 28, granulocytes, monocytes, B cells, CD4+ T cells, CD8+ T cells) and HNSCC cell lines (N = 5 HPV+, N = 34 HPV–). Methylation levels of 47 CpG sites targeting CD28, CTLA4, ICOS, CD80, and CD86 are investigated. The position of the CpG site (promoter, gene body, intergenic) and the correlation with the respective mRNA expression are illustrated
