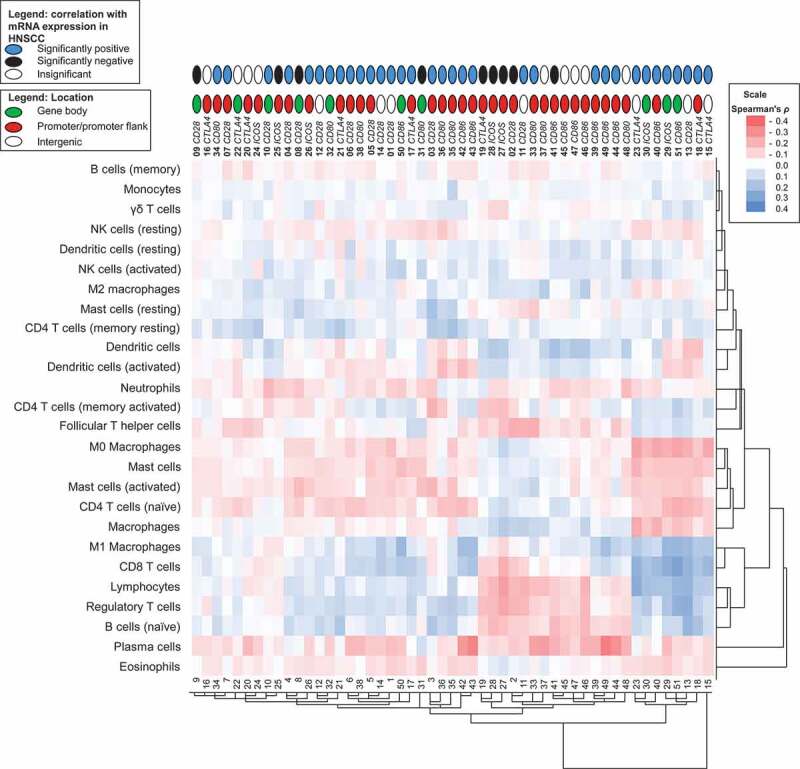
Figure 6.

Unsupervised clustering of correlation coefficients between methylation and signatures of tumour infiltrating immune cells. Shown is a heat map of Spearman’s ρ between methylation and signatures of tumour infiltrating immune cells. RNAseq signatures provided by Thorsson et al. [38] were used to quantify distinct immune cell subsets in the tumour microenvironment. The position of the CpG site (promoter, gene body, intergenic) and the correlation with the respective mRNA expression are illustrated
