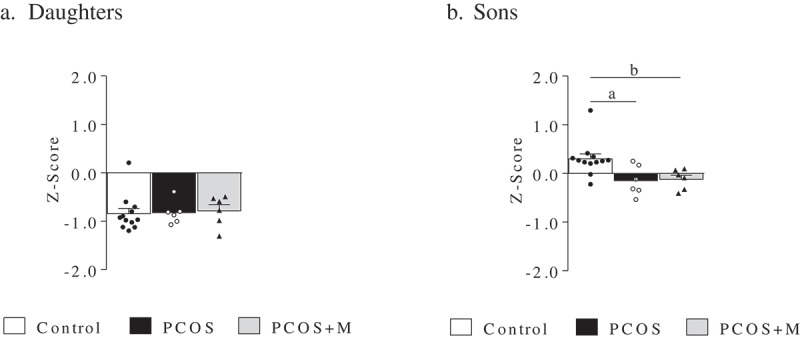
Figure 3.

Z-Score of the promoter regions of LEP, LEPR, ADIPOQ, ADIPOR1, ADIPOR2, AMH and AR in daughters and sons of control (control, n = 12/12), PCOS women (PCOS, n = 6/6) and PCOS women treated with metformin during pregnancy (PCOS+M, n = 6/6). Data are shown as median ± SEM. Dots indicate the cases in each group. Differences were calculated by Kruskal-Wallis test followed by Dunn test. aP < 0.05 between control and PCOS; bP < 0.05 between control and PCOS+M
