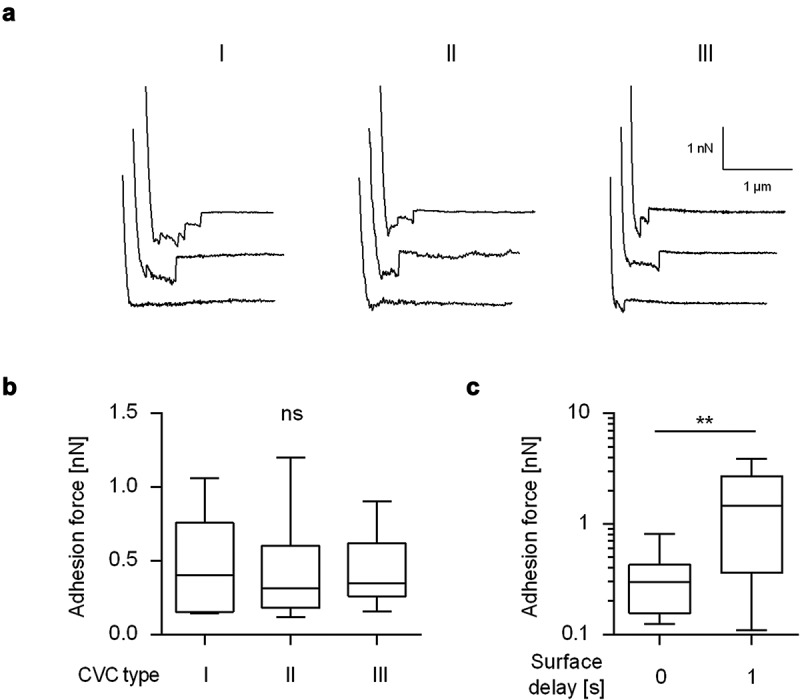
Figure 2.

Maximum adhesion forces of C. albicans yeast cells to naïve CVC surfaces from different manufactures. Individual yeast cells incubated for 30 min in PBS were immobilized on FluidFM micropipettes and used for SCFS on naïve CVC surfaces from three different manufacturers (I to III). A: Representative retraction curves collected from cells that were probed with CVC surfaces from manufacturers I to III without any surface delay (0 s). B: Mean adhesion forces obtained from force/distance curves recorded on CVC surfaces from manufacturers I to III with a surface delay time of 0 s. Data are shown as a box and whisker plot (min-to-max) representing the mean values of 10 individual cells per CVC type. ns, not significant (Kruskal-Wallis test with Dunn’s post hoc test). C: Influence of the surface delay time on the adhesion forces. Yeast cells were probed with the CVC surface with different contact times (0 s and 1 s). Data are shown as a box and whisker plot (min-to-max) representing the mean values of 10 individual cells per time point and condition. ns, not significant; **, P< 0.01 (Mann-Whiney U test)
