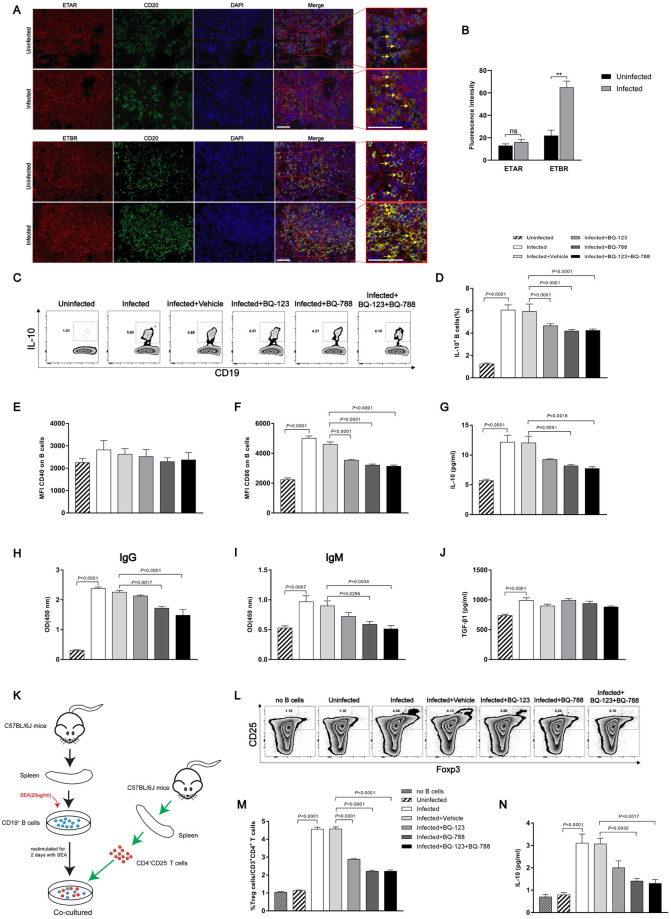
Fig 7. Endothelin receptor antagonists inhibited B cell activation.
(A) Representative immunofluorescence staining of ETAR, ETBR and CD20+ B cells in mouse spleen tissues. Insets show a higher magnification of the outlined area. Yellow arrows denote positive cells. Scale bar, 50 μm. (B) The fluorescence intensity was measured using IPP software (n = 4). (C-J) CD19+ MACS-isolated mouse splenic B cells were restimulated with SEA (20 μg/ml) for 2 days. (C-D) Representative FACS plots and a summary of the intracellular IL-10 expression of B cells after addition of Brefeldin A to the last 4 hours of the culture (n = 7). (E-F) Mean fluorescence intensity of CD40 and CD86 expression (n = 7). (G-J) IL-10, IgG, IgM and TGF-β1 concentration in culture supernatants as determined by ELISA (n = 6–8). (K-N) SEA-restimulated B cells were co-cultured for 4 days with CD25- depleted CD4 T cells. (L-M) The frequency of CD25+Foxp3+ Treg cells after co-culture, as shown in a representative FACS plots and summarized (n = 7). (N) IL-10 concentration in culture supernatants after co-culture (n = 3). Data are represented as mean ± SEM of three independent experiments. Significance was calculated using the two-tailed Student’s t test (B) or one-way ANOVA with Tukey’s correction for comparison between two groups (D-J, M-N). ns, not significant; **P< 0.01.

