Figure 1.

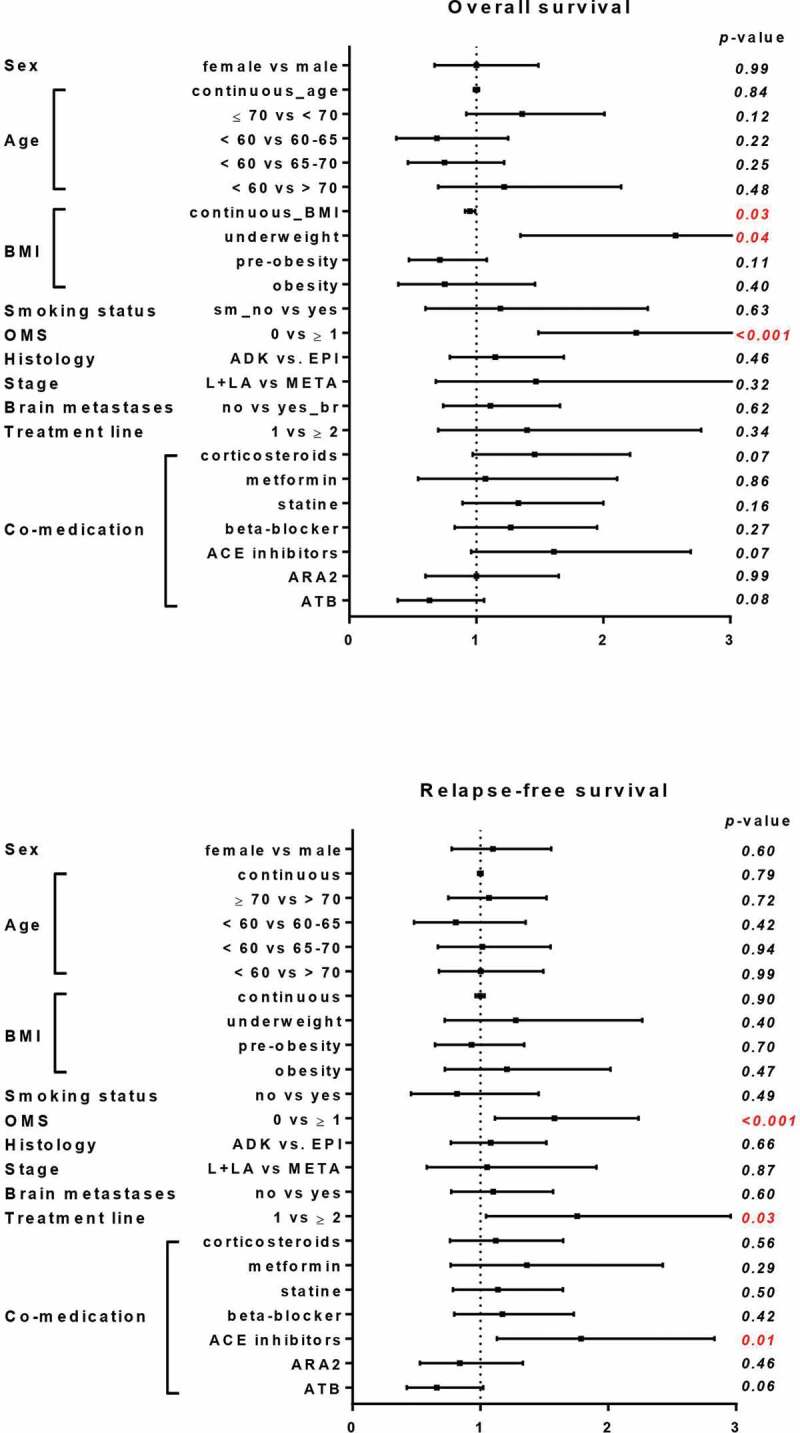
Effect of patient’s characteristics, treatments and co-medication on PFS and OS. Forest plot of hazard ratios for PFS and OS. Corresponding 95%CI and p-values are represented

Effect of patient’s characteristics, treatments and co-medication on PFS and OS. Forest plot of hazard ratios for PFS and OS. Corresponding 95%CI and p-values are represented