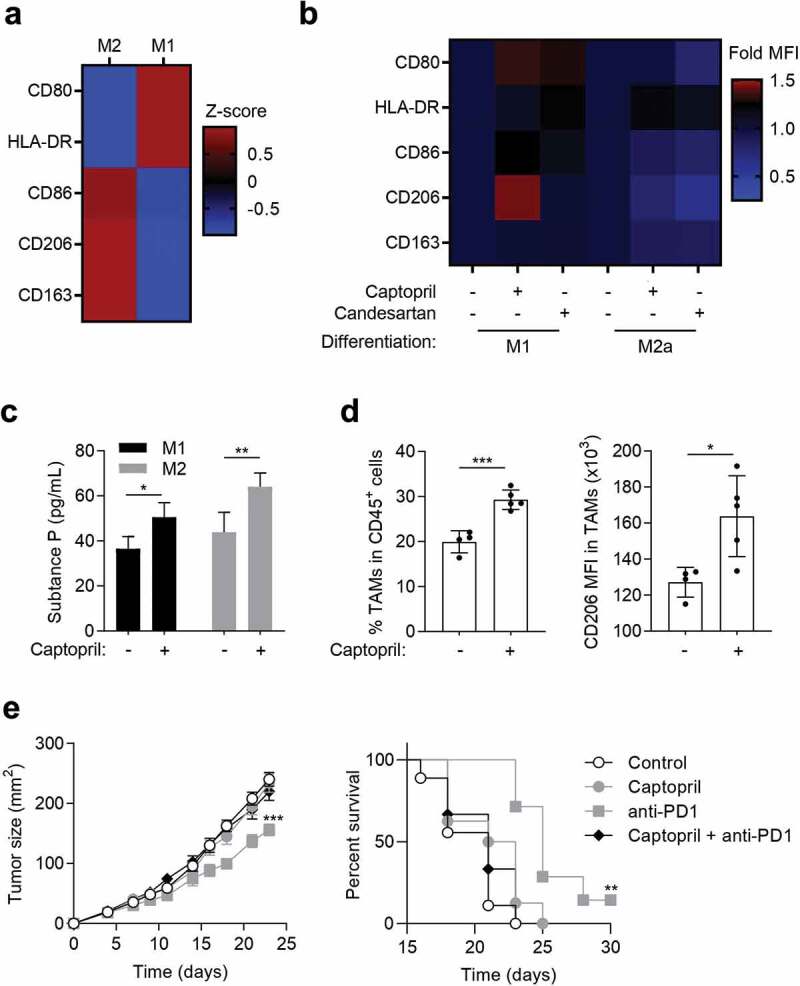
Figure 4.

Effect of captopril on macrophages. (a to c) Human monocytes (n = 3) were differentiated for 6 d into M1 or M2 macrophages. (a and b) Expression level (mean MFI of 3 different donors) of different markers after cell staining with specific antibodies to analyze M1 and M2 differentiation by flow cytometry. (a) MFI z-score of markers expression at basal level. (b) Fold expression of the different markers analyzed by flow cytometry to compare human monocytes differentiated for 6 d into M1 or M2 macrophages with or without captopril (100 µM) or candesartan (10 µM). (c) Human monocytes were differentiated for 6 d into M1 or M2 macrophages with or without captopril (100 µM) and substance P concentration in cell supernatants was evaluated by ELISA. Data represent the mean of 3 different donors ± s.d. *, p < .05; **, p < .01. (d and e) MC38 tumor bearing mice were daily treated or not per os with 25mg/kg captopril with or without i.p. injections of 10mg/kg anti-PD-1 mAb three times a week. (d) Macrophage occurrence in tumors and CD206 expression in TAMs (n = 4 or 5 animals per group) were analyzed by flow cytometry. (e) Tumor size was monitored (mean ± s.e.m) and mice survival was calculated (n = 7 to 9 animals per group). *, p < .05; **, p < .01; ***, p < .005
