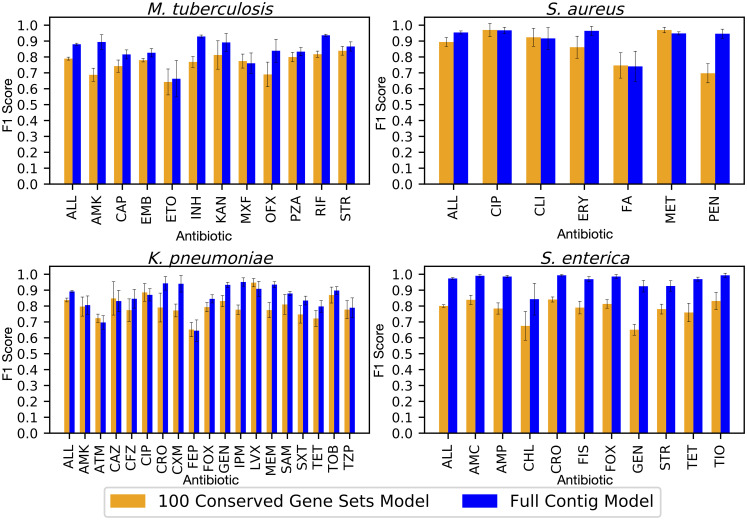
Fig 2. Average F1 scores by antibiotic for ten models built from non-overlapping sets of 100 core genes (orange bars) compared with the F1 scores for models built from whole assembled contigs for the same genomes (blue bars).
Error bars represent 95% confidence intervals for the whole genome model, and the minimum and maximum confidence interval observed in all ten replicates for the core gene models. Antibiotic abbreviations are defined in Table 2.

