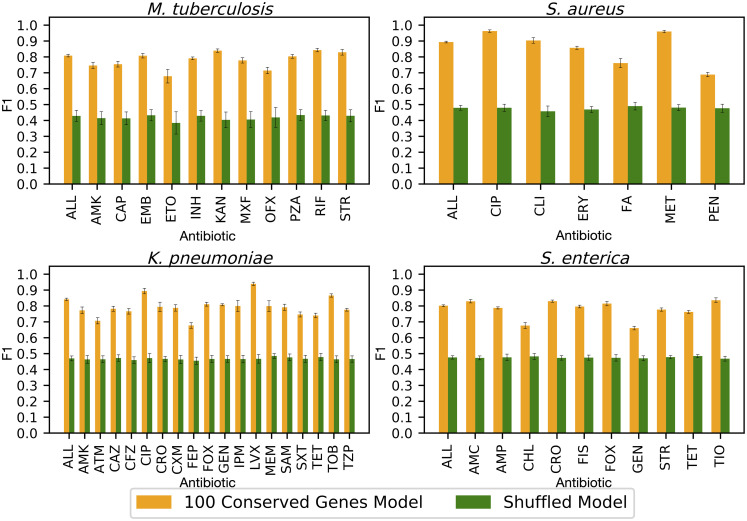
Fig 5. Average F1 scores by antibiotic for ten models built from non-overlapping sets of 100 core genes (orange bars) versus the same model where the AMR phenotypes have been randomized (green bars).
Error bars represent the minimum and maximum 95% confidence observed in all ten replicates. Antibiotic abbreviations are defined in Table 2.

