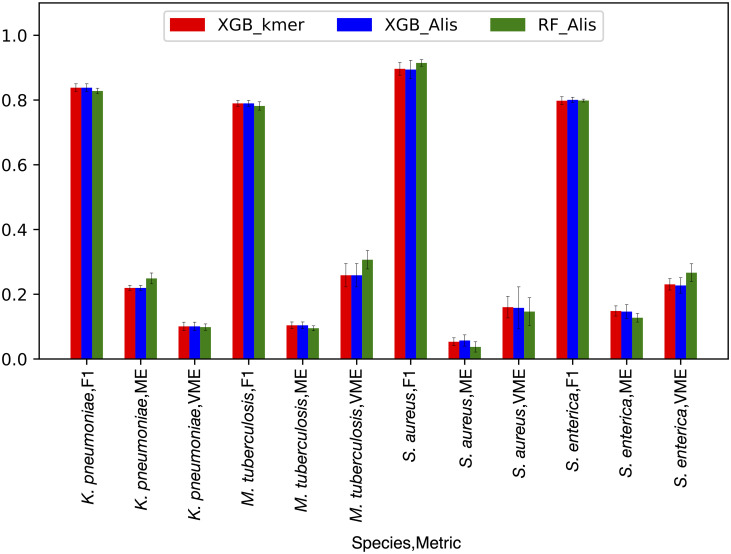
Fig 6. A comparison of algorithms and features.
The same set of 100 randomly-selected core genes was used to build each model. Each set of bars represent the F1, ME, and VME scores for K. pnuemoniae, M. tuberculosis, S. enterica, and S. aureus, respectively. The red, blue, and green bars represent the accuracy metrics (F1, ME, or VME) for the XGBoost model built from k-mers for the gene set, XGBoost model built using a concatenated alignment where the columns were one-hot encoded, and random forest model built using a concatenated alignment where columns were one-hot encoded, respectively. Error bars depict the 95% confidence interval.

