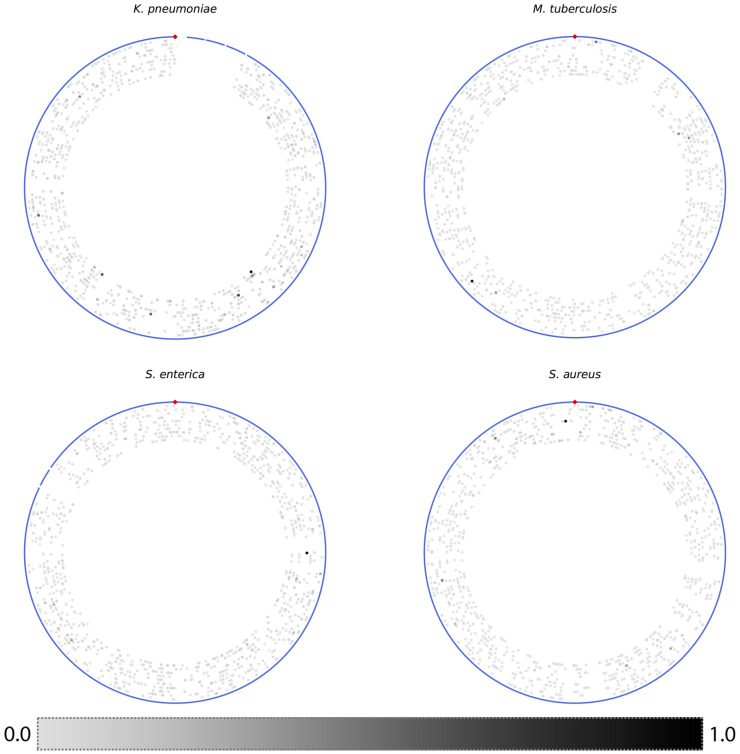
Fig 8. Plots showing the position and total feature importance of each core gene based on its coordinates in a reference genome.
The contigs from the reference genome are depicted as blue lines on the outside of each plot, and the origin of replication is shown at the top with a red diamond. Each gene is depicted as a gray dot, and the genes with higher total feature importance in each model are colored in darker shades of gray. The genes of each model are shown as concentric circles from outside to inside. The reference strains used were K. pneumoniae HS11286, M. tuberculosis H37Rv, S. enterica serovar Typhimurium LT2, and S. aureus NCTC 8325.

