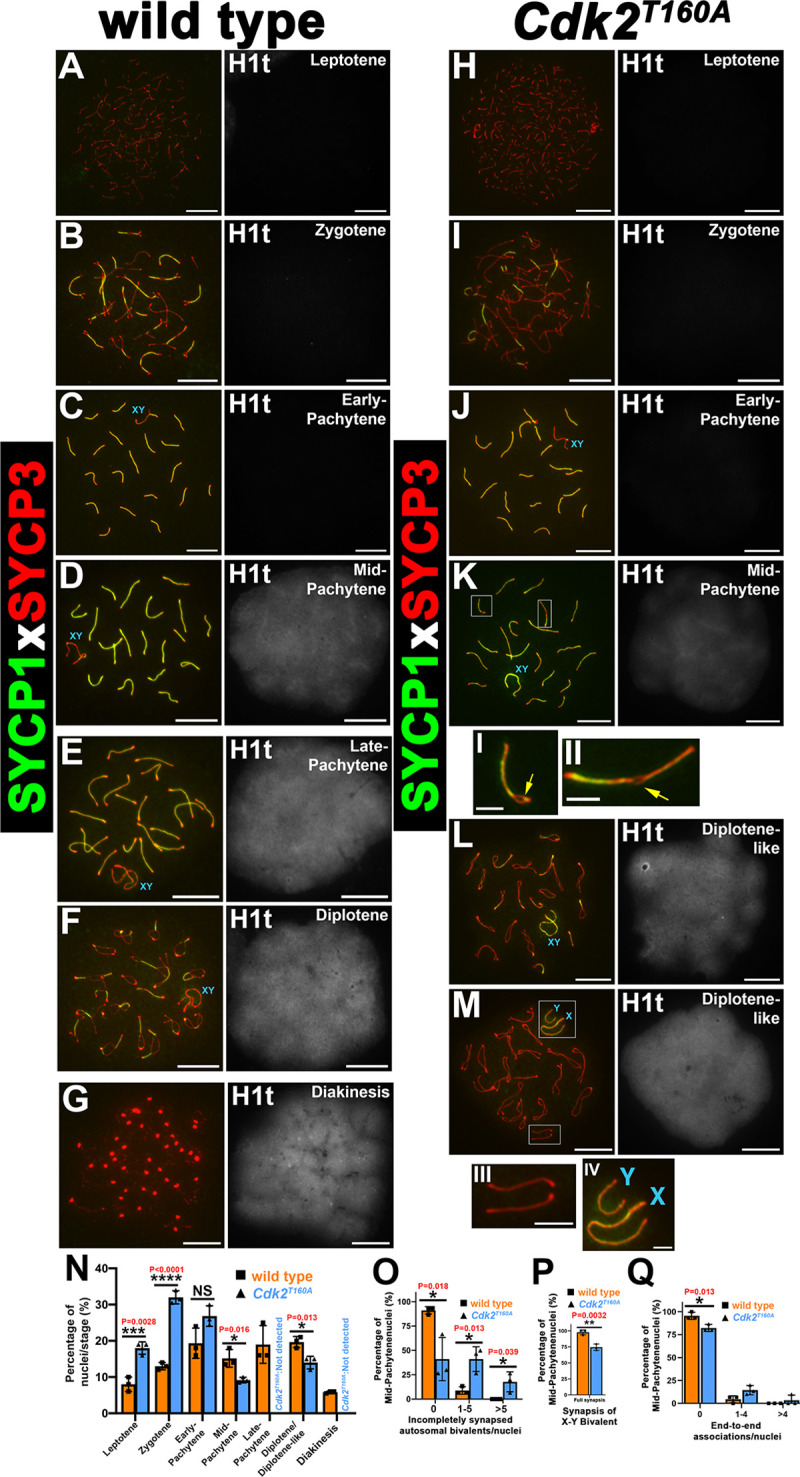
Fig 1. SC formation, meiotic staging analysis, and synaptic defects analysis in Cdk2T160A spermatocytes.

Chromosome spread preparations from adult (postnatal day 40) testes coimmunostained for SYCP1 (green) and SYCP3 (red) are shown for WT (A–G) or Cdk2T160A spermatocytes (H–M) for selected stages of meiotic prophase I. For staging purposes, histone H1t (white) is shown to the right of each image. H1t positivity is indicative of mid-pachytene stage onwards. During early-pachytene, both WT (C) and Cdk2T160A (J) spermatocytes show SYCP3 colocalization with SYCP1, indicating the normal formation of the SC scaffold structure. WT spermatocytes progress normally into mid-pachytene (D), late-pachytene (E), diplotene (F), and diakinesis stages (G). Mid-pachytene–stage Cdk2T160A (K) spermatocytes show premature desynapsis. Yellow arrows in insets I and II highlight areas of desynapsis between homologs. Late-pachytene stage is not observed in the Cdk2T160A mutant. Instead, meiosis progresses to a diplotene-like stage with desynaspsis observed between both autosomal homologs and the X–Y bivalent (L and M and insets III and IV). All main panels are representative of at least 20 images taken for specified stages. Similar staining patterns were confirmed in at least 3 biological replicates. In all main panels, scale bars are representative of 5 μm; in all inset pictures, scale bars are representative of 1.25 μm. Meiotic staging analysis (N) shows the percentages of spermatocytes observed in each stage of meiotic prophase. Asynapsis was quantified specifically for mid-pachytene stages by counting the percentages nuclei containing incompletely synapsed autosomal bivalents, classified as having incomplete colocalization of SYCP1 and SYCP3 along the entire chromosomal length (O). X–Y bivalent synapsis was quantified specifically for mid-pachytene stages by counting the percentage of nuclei containing fully synapsed X–Y chromosomes, classified as being physically associated with no clear separation (P). End-to-end associations were quantified specifically for mid-pachytene stages by counting the percentages nuclei containing bivalents that were joined end-to-end; the joining of 2 ends between distinct bivalents was quantified as a single event (Q). For N–Q, WT or Cdk2T160A data are shown using orange and blue bars, respectively. Each data point is a mean percentage ± SD determined from 3 biological replicates. For each biological replicate, percentages were determined from at least 200 spermatocyte images. All data were assumed to be non-normally distributed. Statistical significance between genotypes was determined by unpaired t test. Significance and P-values are reported directly over each comparison. The underlying data for (N, O, P, Q) can be found in S1 Data. CDK2, cyclin-dependent kinase 2; SC, synaptonemal complex; SD, standard deviation; SYCP, synaptonemal complex protein; WT, wild-type.
