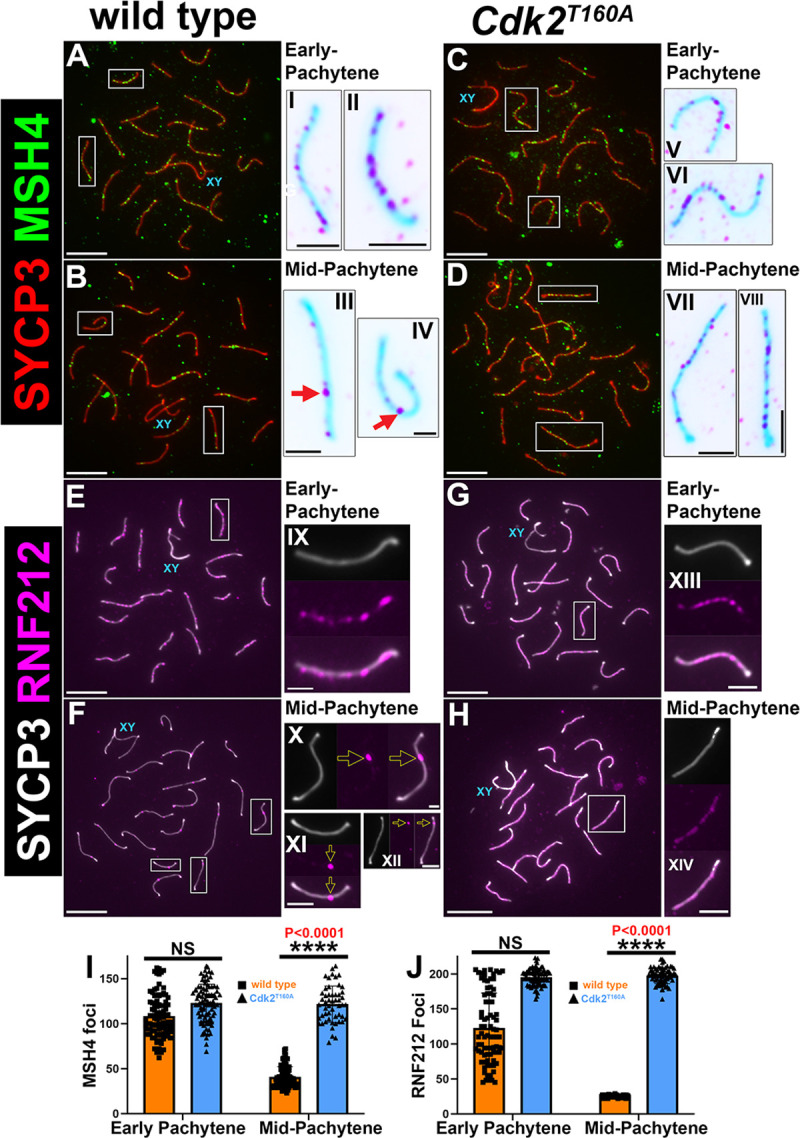
Fig 5. Comparison of MSH4 and RNF212 dynamics in WT and Cdk2T160A spermatocytes.

P40 chromosome spread preparations immunostained for MSH4 (green) and SYCP3 (red) are shown for WT (A–B) and Cdk2T160A spermatocytes (C–D) for selected stages of meiotic prophase I. Inset images are shown in their corresponding inverted color for better visualization of MSH4 foci. In early-pachytene WT and Cdk2T160A spermatocytes, MSH4 foci can be observed along the length of paired axes (A and C, insets I–II and V–VI). MSH4 foci decrease in number as WT spermatocytes progress to mid-pachytene (B, insets III–IV). MSH4 focus numbers remain high in mid-pachytene Cdk2T160A spermatocytes (D, insets VII–VIII). An identical analysis is shown for P40 chromosome spread preparations immunostained for RNF212 (magenta) and SYCP3 (white). Like MSH4, RNF212 foci in early-pachytene WT and Cdk2T160A spermatocytes can be observed along the length of paired axes (E and G, insets IX and XIII). RNF212 foci decrease in number as WT spermatocytes progress to mid-pachytene. At this stage, RNF212 foci mark LRNs (F, insets X–XII). RNF212 focus numbers remain high in mid-pachytene Cdk2T160A spermatocytes (H, inset XIV). All images are representative of at least 20 images taken for equivalent stages. Similar staining patterns were confirmed in at least 3 biological replicates. In all main panels, scale bars are representative of 5 μm; in all inset pictures, scale bars are representative of 1.25 μm. Quantification of MSH4 foci and RNF212 foci counts are shown in panels I and J, respectively. Data are presented as individual foci counts, and WT and Cdk2T160A data are represented using orange or blue bars, respectively. Error bars are indicative of the mean and SD. All data were assumed to be non-normally distributed. Statistical significance between genotypes was determined by unpaired t test. Significance and P-values are reported directly over each comparison. For WT data in I and J, N = 90 for both early-pachytene and mid-pachytene stages. For Cdk2T160A data in I, N = 90 for early-pachytene and N = 42 for mid-pachytene stages. For Cdk2T160A data in J, N = 90 for early-pachytene and N = 45 for mid-pachytene stages. The underlying data for (I, J) can be found in S1 Data. CDK2, cyclin-dependent kinase 2; LRN, late recombination nodule; MSH4/5, MutS protein homolog 4/5; RNF212, ring finger protein 212; SD, standard deviation; SYCP, synaptonemal complex protein; WT, wild-type.
