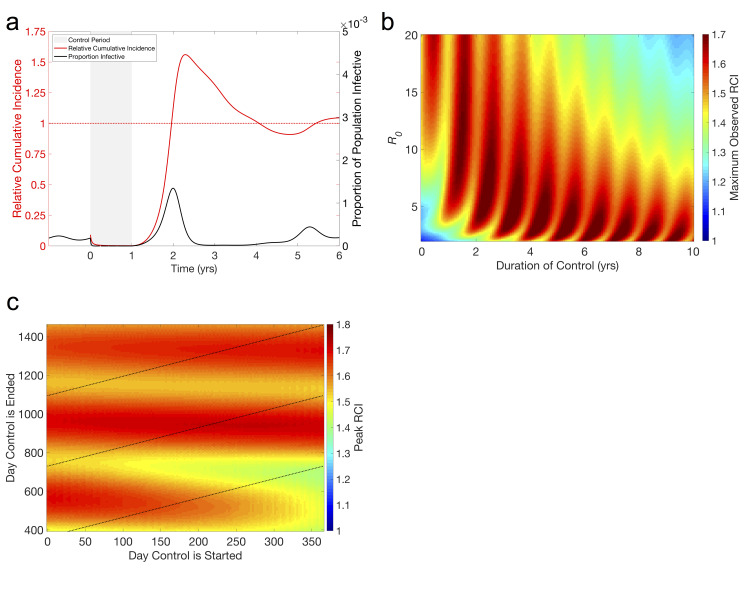
Fig 2. The divorce effect in the seasonal SIR model.
(a) Typical time-series showing the divorce effect. Beginning at time zero, when the transmission parameter is at its maximum, a year-long 90% reduction in the transmission parameter of an endemic infection (R0 = 5, β0 = 365/year, β1 = .02, γ = 73/year) is implemented at the beginning of a seasonal outbreak and reduces prevalence of the infection to near zero for the length of the control. Following the end of the control, a large outbreak, many times the size of the regular seasonal outbreaks, occurs during the next season. RCI falls towards zero as prevalence remains low while the control is in effect and rises above 1 during the large outbreak the following year (Maximum RCI = 1.2). (b) Magnitude of divorce effect in terms of relative cumulative incidence (RCI). Maximum RCI is found as the highest value of RCI observed within 25 yrs following a 100% effective control of an infection with 1<R0<20 and lasting between 1 month and 35 years. RCI>1 indicates the divorce effect and we see that the divorce effect occurs in most of the parameter space. β0 is varied to attain the desired R0, with all other parameters as in (a). (c) Effect of timing on the magnitude of the divorce effect. Maximum RCI is the highest RCI observed within 25 yrs following a 100% effective control of an infection with R0 = 10 (β = 730/year, all other parameters as in (a)) beginning and ending on specified days. Dashed lines represent controls lasting either 1, 2, or 3 years. Unlike the non-seasonal SIR model (Fig 1), the magnitude of the divorce effect is not solely dependent on R0 and the length of the control. Maximum RCI is most sensitive to the day the control is ended, moderately sensitive to the day it is started, and only slightly sensitive to the length of the control. This is due to the timing of the end of the control determining the timing of the outbreak. We also see that continuing the control for another year often has little impact on the magnitude of the divorce effect.

