
Figure 1.
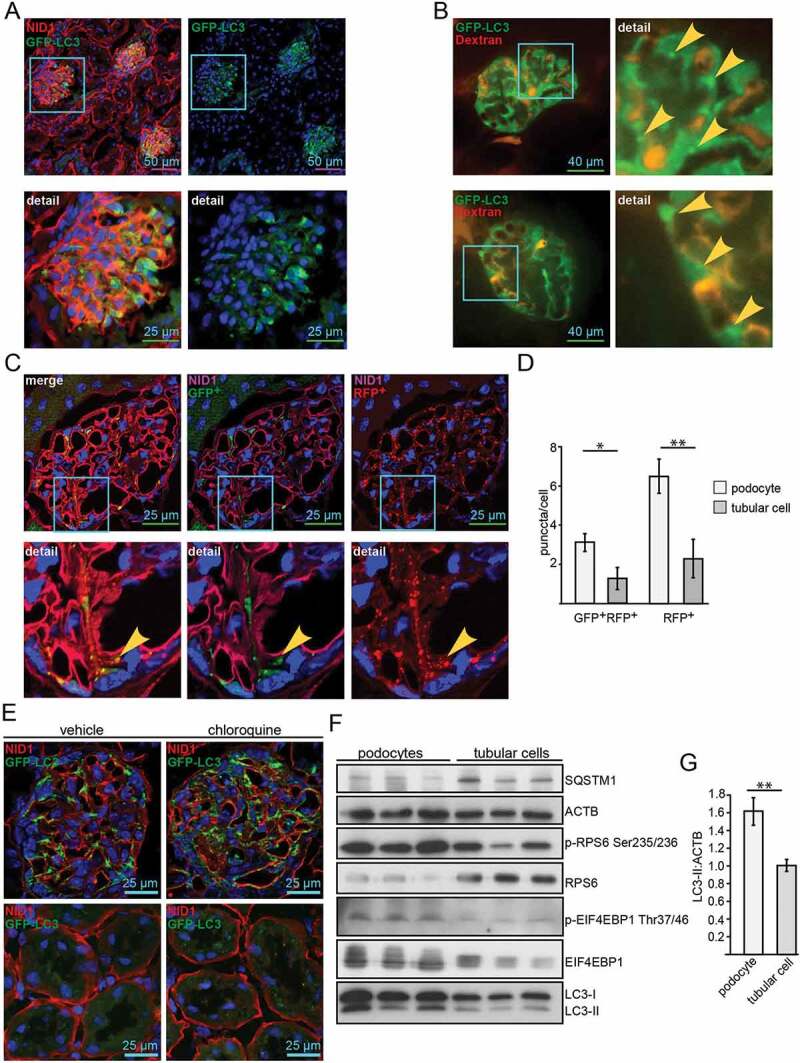
Podocytes exhibit high levels of basal autophagy and autophagic flux. (A) Representative images obtained from cryosections of 4-month old Gfp-Lc3 mice stained for the basement membrane marker NID1/nidogen-1/entactin (red) and GFP-LC3 (green). (B) Two-photon images of glomeruli from Gfp-Lc3 mice perfused with dextran as a marker for glomerular capillaries (in red) displaying autophagosomes in vivo (in green, marked with arrow). (C) Representative images obtained from cryosections of 4-month-old Rfp-Gfp-Lc3 mice stained for NID1 (purple). RFP-LC3 and GFP-LC3 fluorescence is endogenous. (D) Quantification of (C) out of 30 glomeruli from 3 mice each with surrounding tubular cells (** ≤ 0.01, * ≤ 0.05). (E) Cryosections displaying glomeruli (upper panel) and tubular system (lower panel) stained for NID1 (red) and GFP-LC3 (anti-GFP antibody, green) in 4-month-old WT mice with and without chloroquine (4 h after chloroquine [Cq] administration i.p. 100 mg Cq/kg BW). (F) Western blot from immortalized human podocyte cell line and proximal tubular cell line (HK2) for MTORC1 downstream targets and LC3 abundance. (G) Densitometry obtained from (F) (** ≤ 0.01)