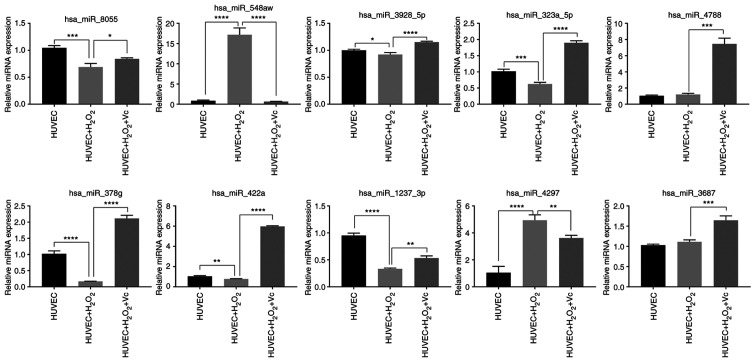
Figure 6.
RT-qPCR analysis of the changes in miRNA expression in H2O2-induced and vitamin C + H2O2-treated human umbilical vein endothelial cells (HUVECs). Data are shown as the means ± standard deviation (n=3). Statistical analysis was performed using one-way ANOVA followed by Bonferroni's post-hoc test. *P<0.05, **P<0.01, ***P<0.001, ****P<0.0001.

