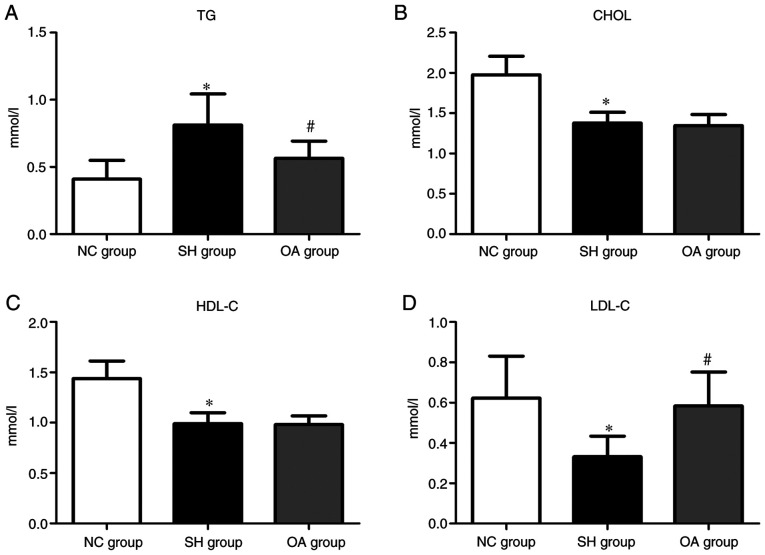
Figure 2.
Levels of serum biochemical markers among the NC, SH and OA groups. Levels of (A) TG, (B) CHOL, (C) HDL-C and (D) LDL-C. Data are presented as the mean ± SD; n=10/group. *P<0.01 vs. NC group; #P<0.01 vs. SH group. NC, normal control; SH, spontaneously hypertensive; OA, oleanolic acid; TG, triglyceride; CHOL, total cholesterol; HDL-C, high-density lipoprotein cholesterol; LDL-C, low-density lipoprotein cholesterol.

