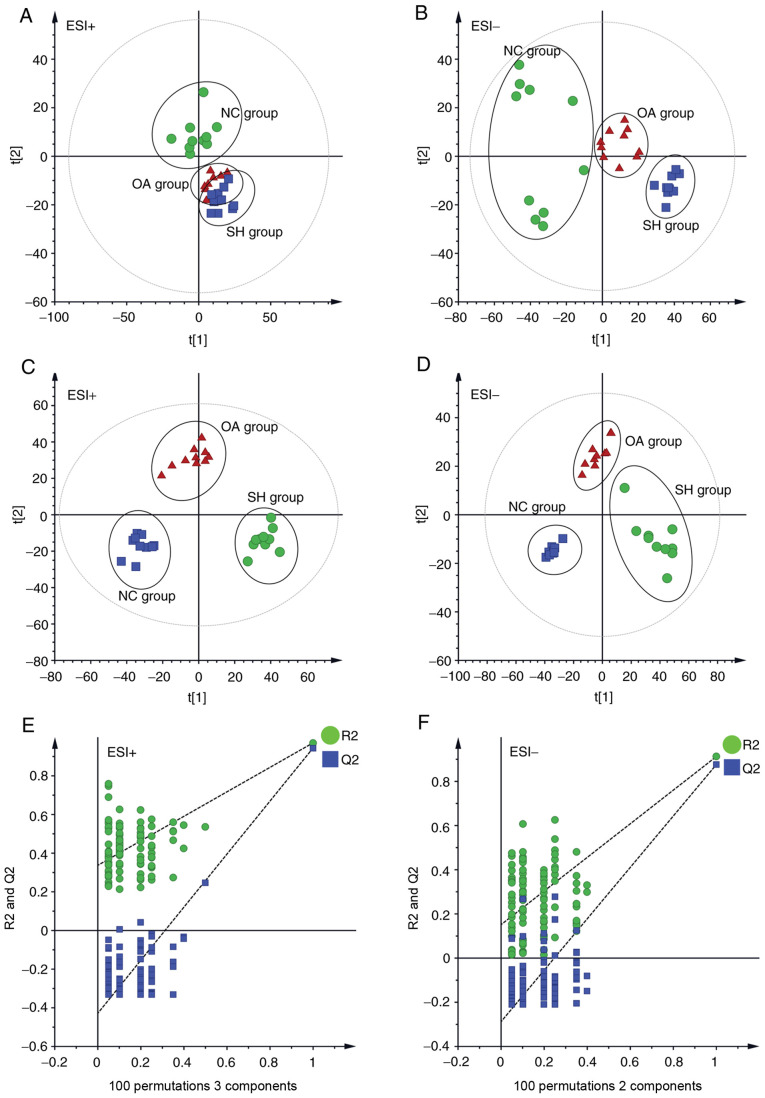
Figure 3.
Multivariate data analysis of liver lipidomics. (A) PCA score plot of the NC, SH and OA groups in the ESI+ mode (R2=0.927). (B) PCA score plot of the NC, SH and OA groups in the ESI- mode (R2=0.839). (C) PLS-DA score plot of the NC, SH and OA groups in the ESI+ mode (R2X=0.509, R2Y=0.971, Q2=0.937). (D) PLS-DA score plot of the NC, SH and OA groups in the ESI- mode (R2x=0.506, R2y=0.915, Q2=0.889). (E) 100 permutation tests of the PLS-DA model in the ESI+ mode (R2=0.337 and Q2=−0.428). (F) 100 permutation tests of the PLS-DA model in ESI- mode (R2=0.151 and Q2=−0.288). NC, normal control; SH, spontaneously hypertensive; OA, oleanolic acid; PCA, principal component analysis; PLS-DA, partial least squares discriminant analysis; ESI, electrospray ionization.

