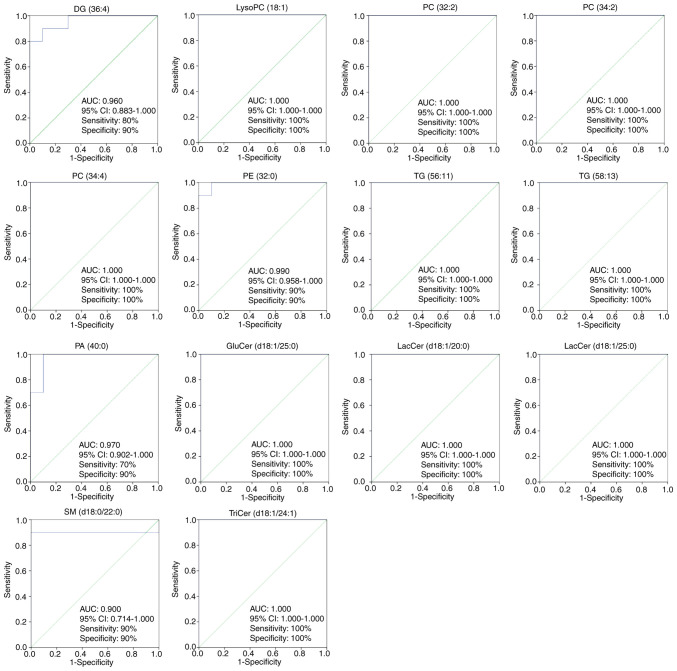
Figure 5.
Partial least squares discriminant analysis-based receiver operator characteristic curves of the 14 lipid species used for the selection of biomarkers for the antihypertensive effects of oleanolic acid. The corresponding AUC, 95% CI, specificities, and sensitivities are presented. LacCer, lactosylceramide; TriCer, trihexosylceramide; GluCer, glucosylceramide; SM, sphingomyelin; PC, phosphatidylcholine; PE, phosphatidylethanolamine; PA, phosphatidic acid; lysoPC, lysophosphatidylcholine; DG, diglyceride; TG, triglyceride; AUC, area under the curve; CI, confidence interval.

