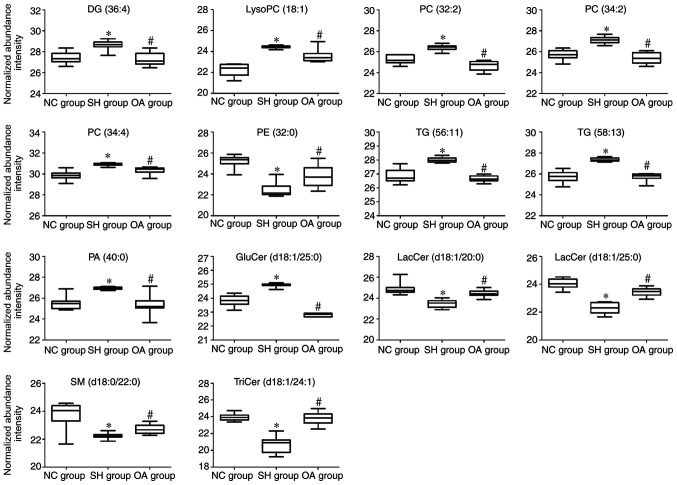
Figure 6.
Box plots representing changes in lipid biomarker levels between the NC, SH and OA groups. *P<0.01 vs. NC group; #P<0.01 vs. OA group. The y-axis shows the log2 normalized abundance intensity. NC, normal control; SH, spontaneously hypertensive; OA, oleanolic acid; LacCer, lactosylceramide; TriCer, trihexosylceramide; GluCer, glucosylceramide; SM, sphingomyelin; PC, phosphatidylcholine; PE, phosphatidylethanolamine; PA, phosphatidic acid; lysoPC, lysophosphatidylcholine; DG, diglyceride; TG, triglyceride.

