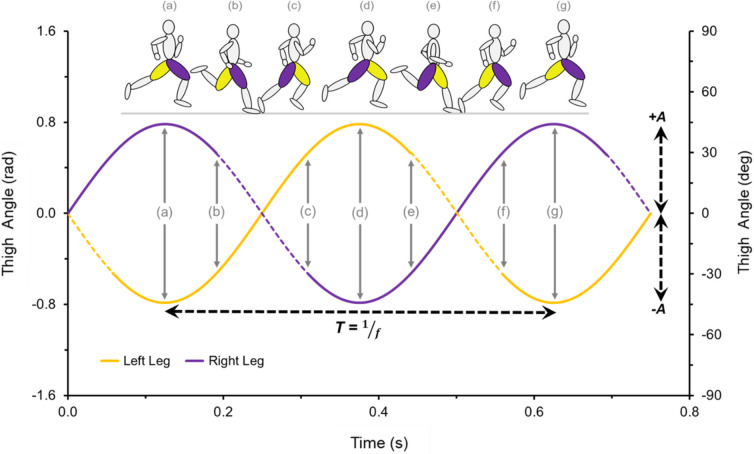
Fig. 7.
Simplified representation of thigh angular motion during the entire gait cycle. This representation assumes symmetrical anti-phase flexion and extension values during ground contact and flight phases. Thigh angular kinematics as a function of time are determined by the parameters of frequency (f=1/T, where T is the period) and amplitude (A). The figures in inset diagrams a–g illustrate the thigh angular position in correspondence with the angular motion presented in the graph. The dashed regions of the graph indicate the ground contact phase, with ωc corresponding to the slope of the angular position versus time curve from touchdown (+0.5 radian) to takeoff (−0.5 radian).

