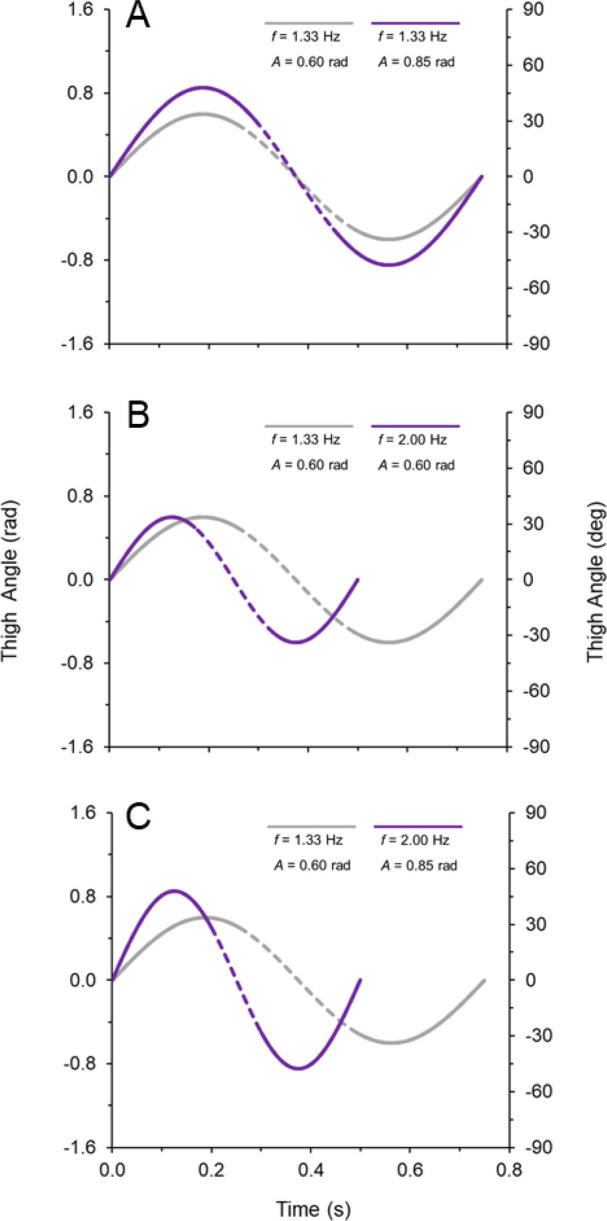
Fig. 8.

Example graphs of thigh angular position versus time for one limb, examining the theoretical effects of altering frequency (f=1/T) and amplitude (A). In A–C, the gray line has f=1.33 Hz and A=0.60 radians. The purple line illustrates the effects on thigh angular velocity that result from altering frequency and amplitude. (A) Increasing A without altering f. (B) Increasing f without altering A. (C) Increasing both A and f. The dashed regions of the graph indicate the ground contact phase, with average ωc corresponding to the slope of the angular position versus time curve. In all three panels, the purple line has greater ωc than the gray line because of increased A and/or f.
