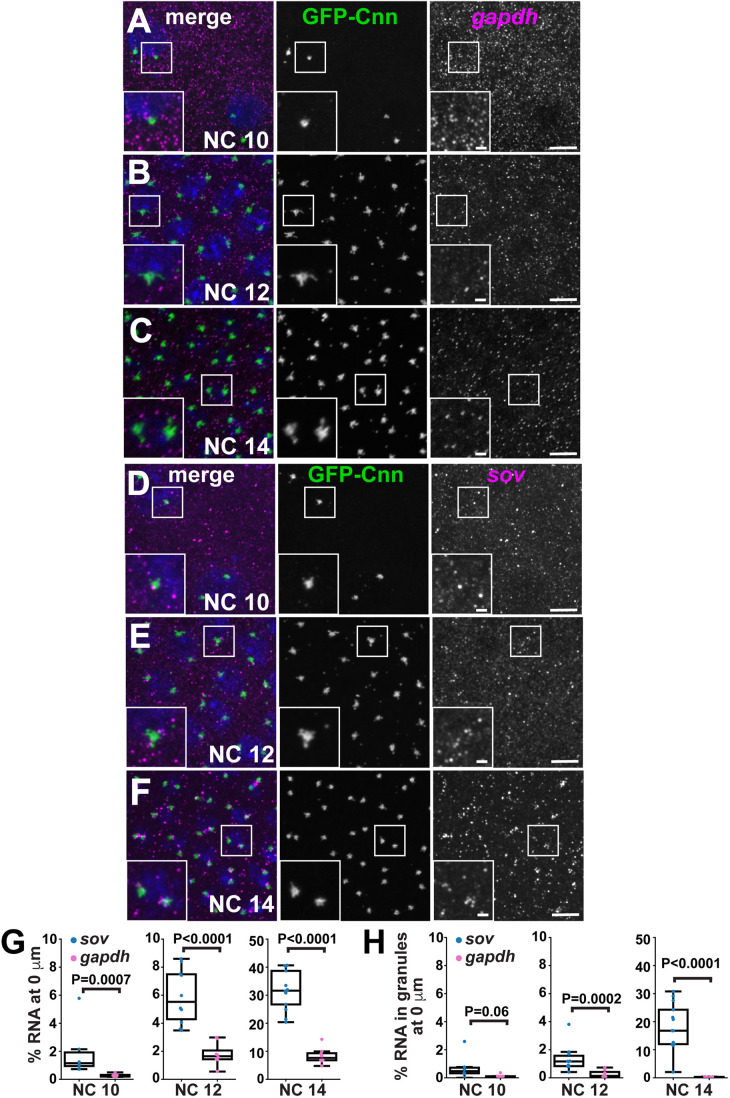
Fig. 3.
Using the SubcellularDistribution pipeline for batch processing larger data sets. Images show maximum intensity projections of mRNA (magenta) and centrosomes (GFP-Cnn; green) within interphase Drosophila embryos. The non-localizing control gapdh mRNA was detected in (A) NC 10, (B) NC 12, and (C) NC 14 embryos. In parallel, sov mRNA was detected in (D) NC 10, (E) NC 12, and (F) NC 14 embryos. (G) Graphs show the percent of RNA overlapping with centrosomes and (H) the percentage of RNA in granules overlapping with centrosomes for the indicated NC stages. Note that the axes are scaled differently for NC 14 to highlight the differences between sov and gapdh. Each dot represents a single measurement from one image, and a box-and-whiskers plot is superimposed. Significance was determined by unpaired t-test or the Mann–Whitney U-test for non-parametric data; n.s., not significant. Scale bars: 5 µm and 1 µm (insets).

