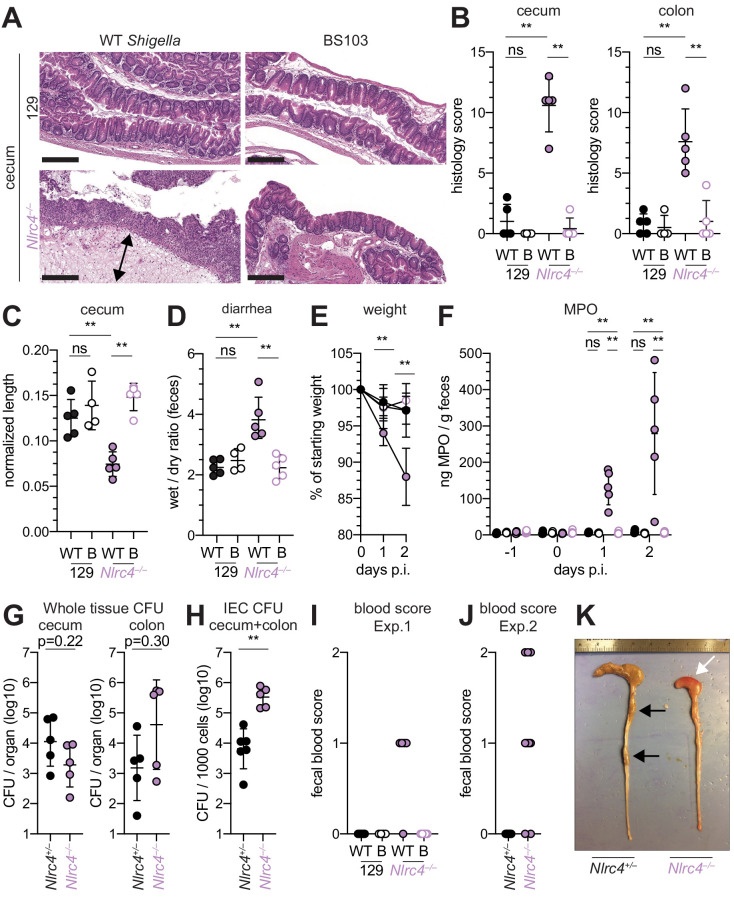
Figure 4. Shigella-infected 129.Nlrc4–/– mice exhibit hallmarks of severe human shigellosis.
(A–H) 129.Nlrc4+/– and 129.Nlrc4–/– littermates were infected as described for Figure 2. Endpoint harvests were performed at 48 hr post-infection (p.i.). (A) Representative images of H&E stained cecum and colon tissue from infected mice. Scale bar, 200 μm. (B) Blinded quantification of histology score (cumulative) for tissues in (A). Edema, hyperplasia, inflammatory infiltrate, and epithelial cell death were scored from 0 to 4. The final score is the sum of individual scores from each category. (C) Quantification of cecum and colon lengths. Values were normalized to mouse weight prior to infection; cecum length (cm) / mouse weight (g). (D) Quantification of feces weights before and after dehydration at 2 days p.i. A larger ratio indicates diarrhea. (E) Mouse weights at 0 through 2 days p.i. Each symbol represents the mean for all mice of the indicated condition. Statistics refer to both WT Shigella-infected 129.Nlrc4+/– and 129.Nlrc4–/– mice and WT versus BS103 Shigella-infected 129.Nlrc4–/– mice at both 1 and 2 days p.i. All other comparisons were non-significant. (F) MPO levels measured by ELISA from feces of 129.Nlrc4+/– and 129.Nlrc4–/– mice collected -1 through 2 days p.i. (G) CFU determination from gentamicin-treated whole tissue homogenates from the cecum or colon (H) CFU determination from the IEC enriched fraction of gentamicin-treated cecum and colon tissue (combined). (I,J) Fecal blood scores from feces at two days p.i. 1 = occult blood, 2 = macroscopic blood. (I and J) show scores from two representative experiments. (K) Representative images of the cecum and colon dissected from 129.Nlrc4+/– and 129.Nlrc4–/– mice. Note the cecum tissue thickening (size reduction), macroscopic edema, and loose stool (absence of arrows), and vascular lesions and bleeding. (B–D,F–J) Each symbol represents one mouse. Filled symbols, WT Shigella; open symbols, BS103. Data are representative of three independent experiments. Mean ± SD is shown in (B, C, D, E, F). Geometric mean ± SD is shown in (G and H). Mann-Whitney test, *p < 0.05, **p < 0.01, ***p < 0.001, ns = not significant (p > 0.05).


