



Abstract
OBJECTIVE:
To examine whether the decision and indications for performing intrapartum cesarean delivery vary by time of day.
METHODS:
We conducted a secondary analysis of a multicenter observational cohort of 115,502 deliveries (2008–2011), including nulliparous women with term, singleton, nonanomalous live gestations in vertex presentation who were attempting labor. Those who attempted home birth, or underwent cesarean delivery scheduled or decided less than 30 minutes after admission were excluded. Time of day was defined as cesarean delivery decision time among those who delivered by cesarean and delivery time among those who delivered vaginally, categorized by each hour of a 24-hour day. Primary outcomes were decision to perform cesarean delivery and the indications for cesarean delivery (labor dystocia, nonreassuring fetal status, or other indications). Secondary outcomes included whether a dystocia indication adhered to standards promoted to reduce cesarean delivery rates. Bivariate analyses were performed using χ2 and Kruskal-Wallis tests for categorical and continuous outcomes, respectively, and generalized additive models with smoothing splines explored nonlinear associations without adjustment for other factors.
RESULTS:
Seven thousand nine hundred fifty-six (22.1%) of 36,014 eligible women underwent cesarean delivery. Decision for cesarean delivery (P<.001) decreased from midnight (21.2%) to morning, reaching a nadir at 10:00 (17.9%) and subsequently rising to peak at 21:00 (26.2%). The frequency of cesarean delivery for dystocia also was significantly associated with time of day (P<.001) in a pattern mirroring overall cesarean delivery. Among cesarean deliveries for dystocia (n=5,274), decision for cesarean delivery at less than 5 cm dilation (P<.001), median duration from 5 cm dilation to cesarean delivery decision (P=.003), and median duration from complete dilation to cesarean delivery decision (P=.014) all significantly differed with time of day. The frequency of nonreassuring fetal status and “other” indications were not significantly associated with time of day (P>.05).
CONCLUSION:
Among nulliparous women who were attempting labor at term, the decision to perform cesarean delivery, particularly for dystocia, varied with time of day. Some of these differences correlate with labor management differences, given the changing frequency of latent phase cesarean delivery and median time in active phase.
Although the cesarean delivery rate in the United States has had a small decline in recent years, about one in three women giving birth in the United States still undergo this procedure.1 Notably, even in a low-risk population of nulliparous women with term, singleton gestations in vertex presentation, the cesarean delivery rate was 26.9% in 2013.2 Although changes in the characteristics of the population may have influenced the decision to perform cesarean delivery, these changes do not seem to sufficiently explain the relatively high cesarean delivery rate.3–6 Furthermore, an increased cesarean delivery rate has not been associated with overall improvement in maternal and neonatal outcomes.7 Therefore, it is prudent to examine nonmedical factors, particularly system-based influences, which may contribute to the trend.
Time of day can be used as an indirect measure of system-based factors, encompassing staffing (shift work, office hours, “hand-offs” of patient care between providers), provider (sleep deprivation, fatigue, decreased vigilance), and structural (availability and quality of staff and support personnel, and accessibility of procedures and resources) factors. As such, the relationships between time of day and important obstetric outcomes, including the cesarean delivery rate,8–12 have been studied previously. However, data regarding the relation between time of day and the actual decision to perform an intrapartum cesarean delivery (rather than just the timing of the surgery itself), as well as whether the recommendation for cesarean delivery adheres to published standards, are lacking. Because the occurrence of vaginal birth appears to be fairly evenly distributed by hour of day in a more natural setting (ie, out-of-hospital setting),13 delineation of temporal differences in the decision to perform cesarean delivery may give insight into modifiable systems factors that could be targeted to safely reduce the cesarean delivery rate.
The objective of our study was to determine whether the decision to perform an intrapartum cesarean delivery and the indications for performing intrapartum cesarean delivery varied by time of day. Furthermore, we sought to determine whether the decision to perform a cesarean delivery for labor dystocia met the same criteria throughout the day.
METHODS
This is a secondary analysis of data from the APEX (Assessment of Perinatal Excellence) study,14 a large multicenter observational study performed at 25 hospitals in the United States from 2008 to 2011. In this study, clinical data for patients who were at least 23 weeks of gestation with a live fetus on admission were collected by trained research personnel at each study site, resulting in a cohort of 115,502 women and their neonates. Maternal demographics, medical and obstetric history, intrapartum care characteristics, and obstetric outcomes were collected. Full details of the methodology have previously been published.14,15 Institutional review board approval was obtained from all participating centers under a waiver of informed consent.
In the present analysis, we included all nulliparous women with term, singleton, nonanomalous gestations in vertex presentation who attempted labor on the labor and delivery unit. Women were included if their admission data documented the type of labor as “spontaneous,” “spontaneous, augmented,” or “induced.” Women were excluded if a home birth was attempted or if they were ineligible for vaginal deliveries (eg, placenta previa, prior cavity-entering myomectomy, or active herpes infection). Women were also excluded if they underwent a scheduled cesarean delivery, or if the decision to perform a cesarean delivery was made less than 30 minutes after labor and delivery admission, because it was assumed that a trial of labor was unlikely to have been attempted in these cases. Furthermore, women for whom exposure or outcome data were missing were excluded (Fig. 1).
Fig. 1.
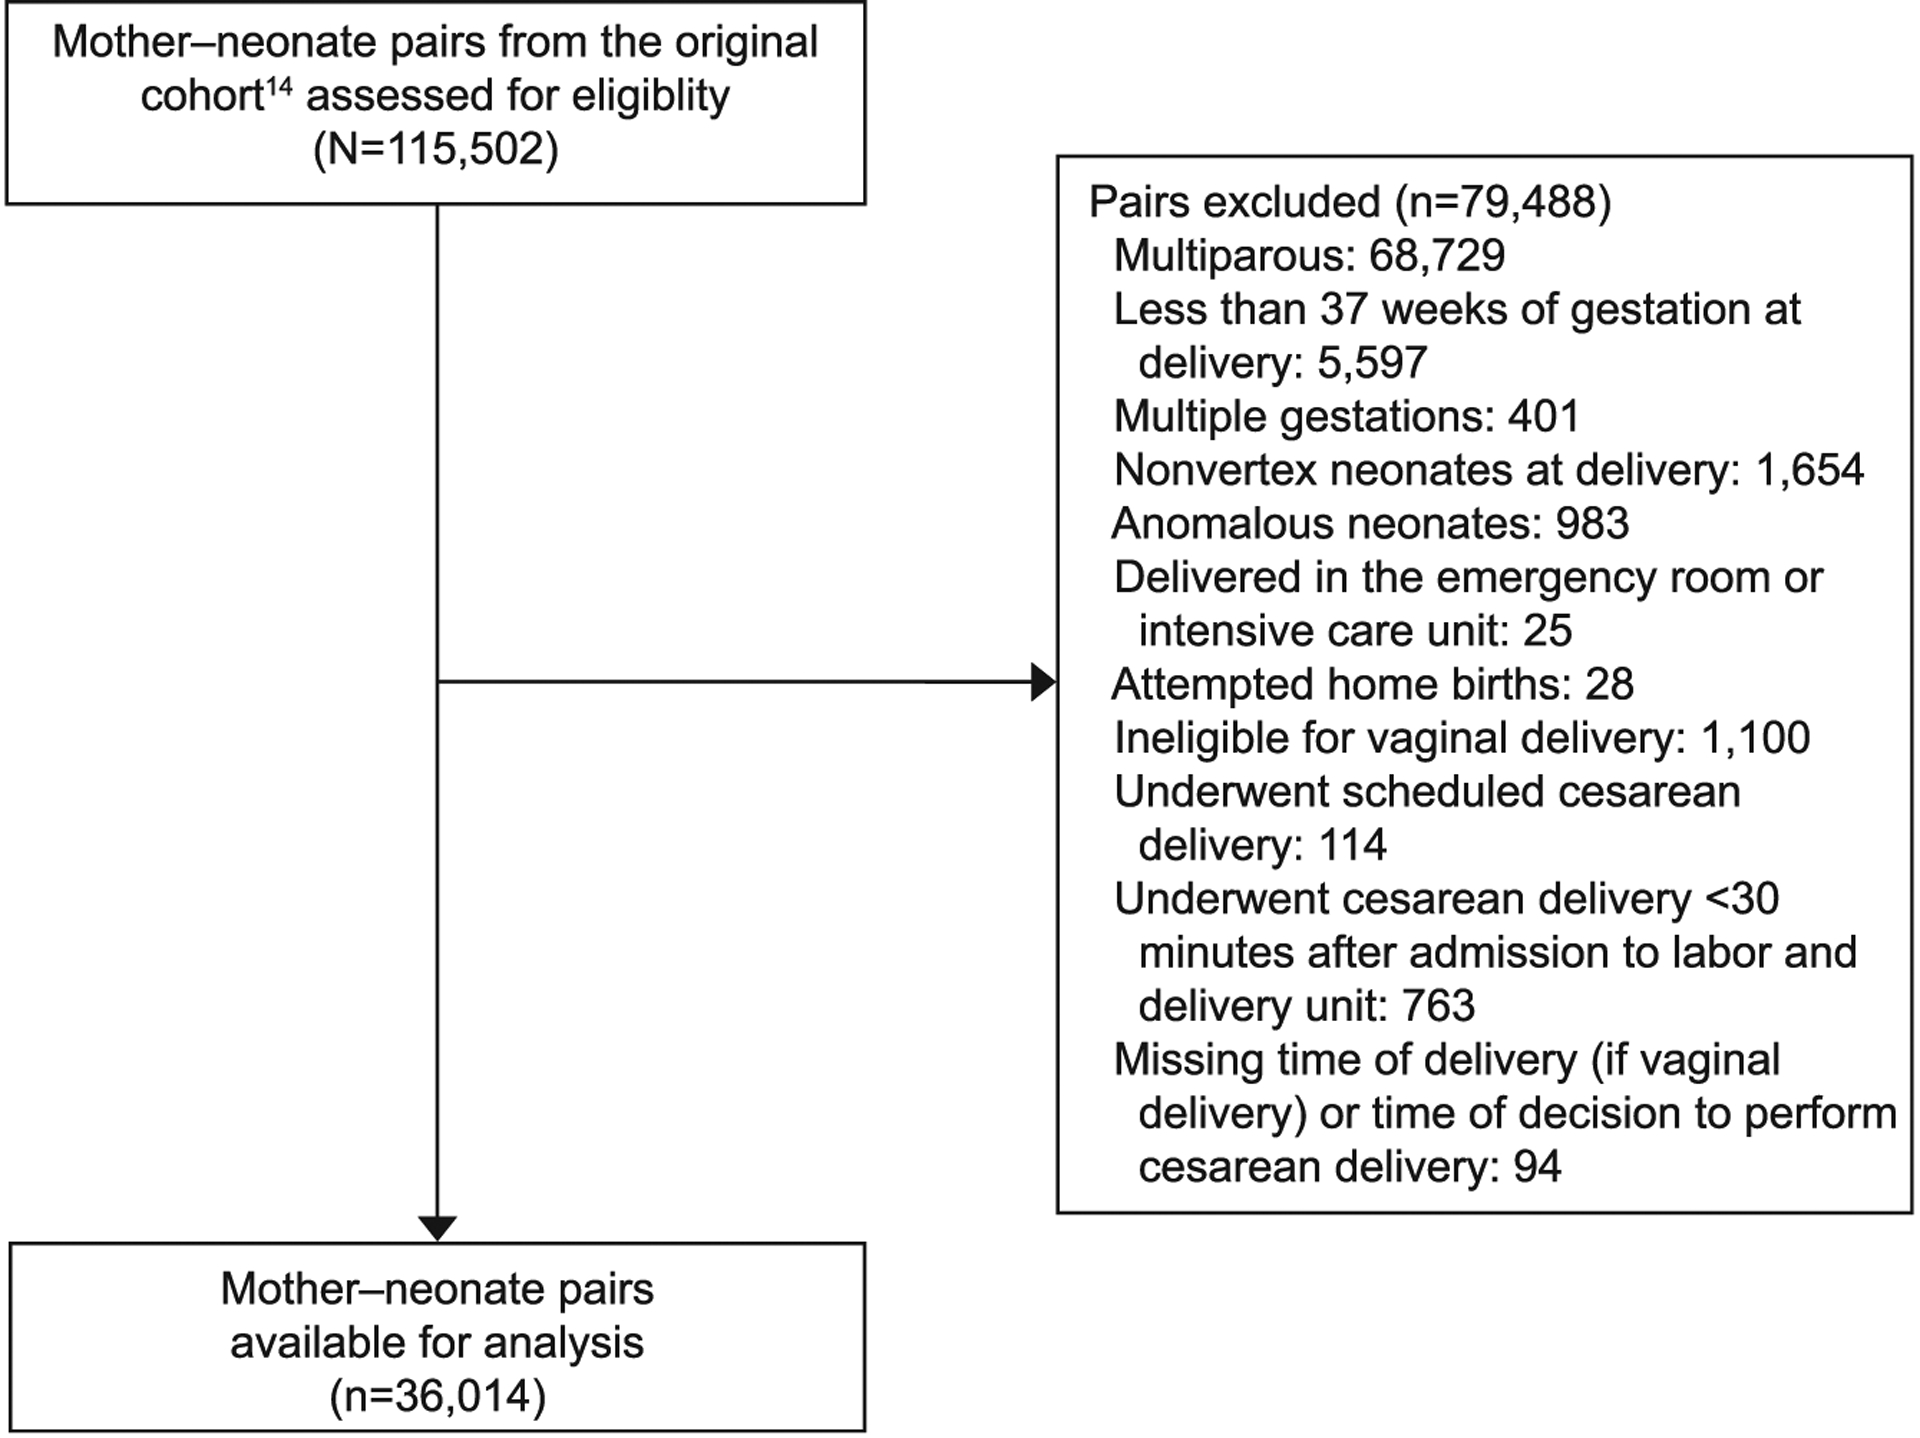
Flowchart illustrating composition of the sample of nulliparous women with term, singleton, nonanomalous gestations in vertex presentation who attempted labor on the labor and delivery unit.
Son. Time of Day and Intrapartum Cesarean Delivery. Obstet Gynecol 2020.
The exposure of interest was time of day, which was defined as the time the decision was made to perform cesarean delivery among those who delivered by cesarean delivery or the time of delivery among those who delivered by vaginal delivery. The time of the decision for the cesarean delivery was directly abstracted by the research personnel from the medical record. Time of day was categorized by each hour of a 24-hour day.
The primary outcome was the frequency of cesarean delivery. This was calculated as a time-specific ratio of women who had a decision for cesarean delivery made in a particular hour over the total number of deliveries in that hour. The primary stated indication for the cesarean delivery also was evaluated. The indications assessed included labor dystocia (inclusive of arrest of dilation, arrest of descent, or failed induction of labor), nonreassuring fetal status, and “other” reasons (such as cord prolapse, suspected macrosomia, placental abruption, and maternal medical complications). Each primary indication was separately calculated as the ratio of women who had each primary indication for cesarean delivery in a particular hour over the total number of deliveries in that hour.
For women who underwent cesarean delivery for the indication of labor dystocia, prespecified secondary aims were to determine whether the indication of dystocia adhered to thresholds promoted to safely reduce primary cesarean delivery, as propounded by the American College of Obstetricians and Gynecologists and the Society for Maternal-Fetal Medicine consensus guidelines.16 First, to evaluate decisions during the latent phase, we assessed the proportion of women who underwent cesarean delivery for a diagnosis of dystocia before 5 cm cervical dilation.16–19 Second, to evaluate the length of active phase, among women who reached 5 cm cervical dilation but did not achieve complete cervical dilation (ie, 10 cm dilation), we assessed the median time from cervical dilation of at least 5 cm to the decision to perform cesarean delivery for dystocia. For analyses of both latent and active phase, 5 cm was used because of availability of this threshold in the APEX database and prior use of 5 cm in the diagnosis of failed labor induction.18 To evaluate the adequacy of the second stage of labor, among women who had reached complete cervical dilation, we assessed the median time from complete cervical dilation to the decision to perform cesarean delivery.16,20–22 We also assessed the proportion of women in the second stage with a time interval from complete dilation to decision for cesarean delivery of less than 3 hours among those without epidural analgesia or less than 4 hours among those with epidural analgesia. The denominator used to calculate these proportions was the number of women who had labor dystocia as the primary indication for cesarean delivery in each particular hour assessed.
Bivariate analyses were performed using the chi-squared test and Wilcoxon rank sum test (or Kruskal-Wallis test) for categorical and continuous outcomes, respectively, and generalized additive models with smoothing splines were used to explore nonlinear associations between time of day and cesarean delivery rates without adjustment for other factors. We evaluated the existence of a “weekend effect”23 to determine whether any observed patterns varied according to weekday (Monday–Friday) compared with weekend (Saturday and Sunday). We also examined whether any observed patterns differed between hospitals that were “teaching” as opposed to “non-teaching” institutions. The categorical variable used to determine teaching as opposed to nonteaching was based on the study question: “Do you ever have OB residents on L&D?.” In addition, cesarean delivery for dystocia was investigated by distinguishing those who had a diagnosis of labor dystocia after spontaneous onset of labor compared with after labor induction. For each interaction analysis, the variable of interest (ie, “weekend,” “teaching hospital,” and “labor induction”) was included in the generalized additive models to evaluate its significance. Lastly, to test the possibility that the inclusion of data from 25 different hospitals may have an effect, the generalized linear mixed models were used with random intercept effects for different hospitals to explore associations between time of day and cesarean delivery rates. All tests were two-tailed and a P-value of <0.05 was used to define statistical significance. SAS 9.4 and R 3.2.5 software were used for statistical analyses and graphics.
RESULTS
A total of 36,014 women met eligibility criteria and were available for analysis (Fig. 1). Of these women, 7,956 (22.1%) underwent cesarean delivery, 5,274 (14.7%) had a primary indication of labor dystocia, 2,481 (6.9%) had a primary indication of nonreassuring fetal status, and 201 (0.6%) had “other reasons.” Demographic and obstetric characteristics of the study population are shown in Table 1.
Table 1.
Characteristics of the Study Cohort (N=36,014)
| Variable | Value |
|---|---|
| Maternal age (y) | 25.8±6.1 |
| Race and ethnicity | |
| Non-Hispanic white | 17,331 (48.1) |
| Non-Hispanic black | 7,286 (20.2) |
| Hispanic | 6,771 (18.8) |
| Asian | 2,445 (6.8) |
| Other | 2,181 (6.1) |
| Primary source of medical care payment | |
| Uninsured, self-pay, government-assisted insurance | 15,797 (44.2) |
| Private insurance | 19,925 (55.8) |
| BMI (kg/m2) | 30.7±6.0 |
| Diabetes | 1,822 (5.1) |
| Chronic hypertension | 654 (1.8) |
| Preeclampsia, gestational hypertension | 3,880 (10.8) |
| Magnesium used for seizure prophylaxis | 1,658 (4.6) |
| Anticoagulation use | 191 (0.5) |
| Induction of labor | 13,448 (37.3) |
| Oxytocin use | 26,620 (73.9) |
| Suspected chorioamnionitis | 3,284 (9.1) |
| Neuraxial anesthesia | 24,313 (71.4) |
| Gestational age (wk) | 39.7±1.1 |
| Neonatal birth weight (g) | 3,338±442 |
BMI, body mass index.
Data are mean6SD or n (%).
Time of day was significantly associated with the decision to perform a cesarean delivery (P<.001), with a decreasing frequency from midnight (21.2%) to morning with nadir at 10:00 (17.9%), and then a subsequent increasing frequency that peaked at 21:00 (26.2%) (Fig. 2A). The frequency of dystocia as the indication for cesarean delivery among all deliveries (N=36,014) also was significantly associated with the time of day (P<.001) in a pattern that mirrored that of the overall decision for cesarean delivery (Fig. 2B). Among those who had cesarean delivery performed for the indication of dystocia (n=5,274), the decision for cesarean delivery at less than 5 cm dilation was significantly associated with time of day (P<.001) with a maximal frequency at 12:00 (31.7%) and then a decline in the early morning hours with a nadir at 05:00 (11.4%) (Appendix 2, available online at http://links.lww.com/AOG/B732). Similarly, the median duration of time from 5 cm dilation to cesarean delivery decision also significantly varied with time of day (P=.003), with the shortest duration occurring at 18:00 (5.7 [interquartile range 3.6–8.5] hours) and the longest duration occurring at 07:00 (8.3 [interquartile range 4.9–11.2] hours) (Appendix 2, http://links.lww.com/AOG/B732). The median duration of time from complete dilation to cesarean delivery decision significantly differed by time of day (P=.014), with the shortest duration occurring at 18:00 (2.4 [interquartile range 1.7–3.1] hours) and the longest duration occurring at 9:00 (3. 7 [interquartile range 2.2–4.6] hours) (Appendix 2, http://links.lww.com/AOG/B732). However, the proportion of women in the second stage with a time interval from complete dilation to cesarean delivery decision of less than 3 hours among those without epidural analgesia or less than 4 hours among those with epidural analgesia did not significantly differ by time of day (P=.786).
Fig. 2.
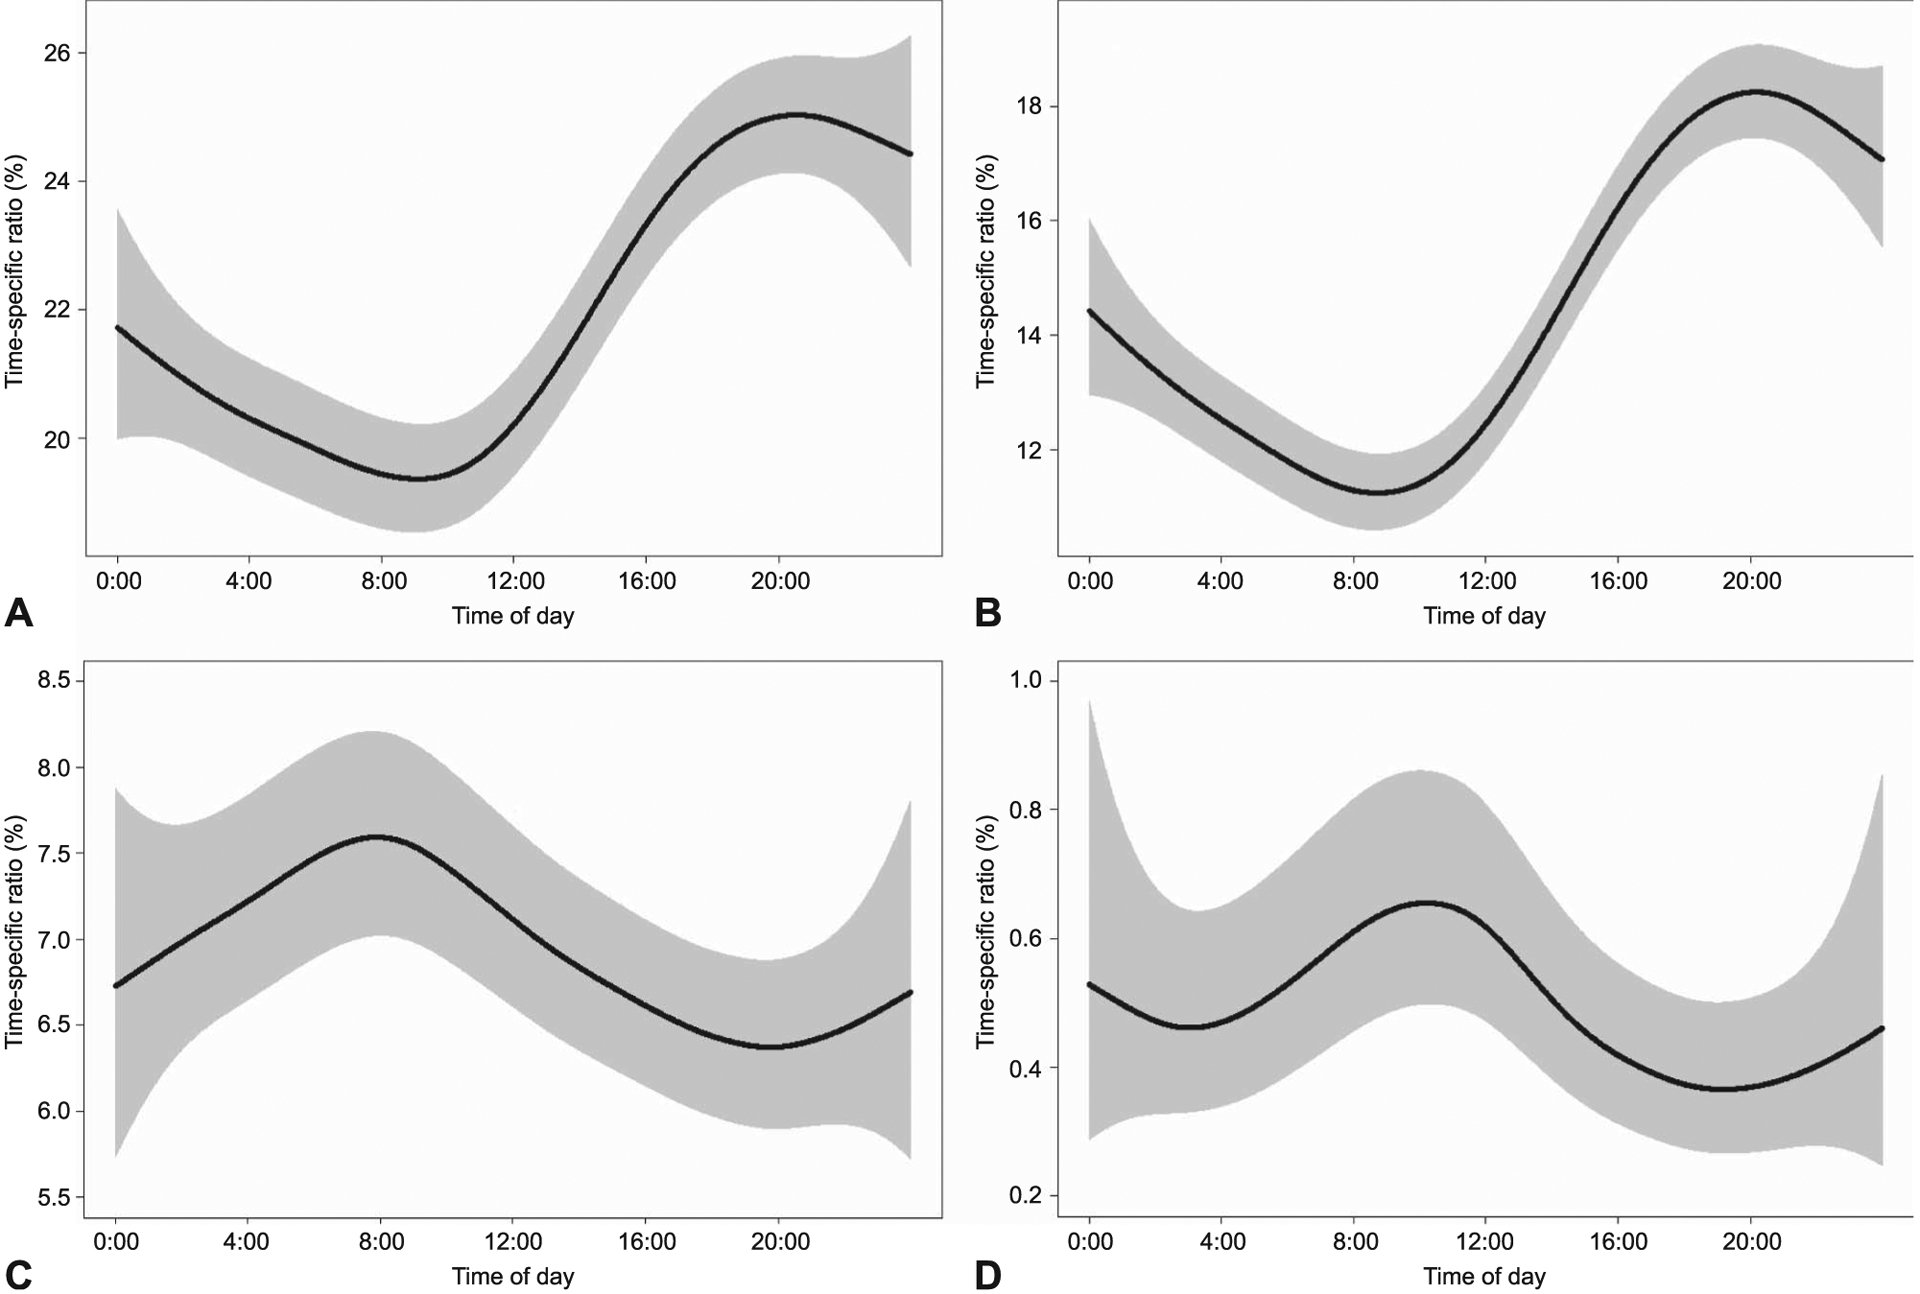
Associations between time of day (using decision time to perform cesarean delivery) and decision to perform cesarean delivery/total birth ratio (A), decision to perform cesarean delivery for the indication of dystocia/total birth ratio (B), decision to perform cesarean delivery for the indication of nonreassuring fetal status/total birth ratio (C), and decision to perform cesarean delivery for other indications/total birth ratio (D). The dark lines indicate the estimated probability of outcome by time of day (0–24 hours), and the shaded regions indicate the 95% confidence limits. The probabilities and confidence limits were calculated by generalized additive models.
Son. Time of Day and Intrapartum Cesarean Delivery. Obstet Gynecol 2020.
The frequency of nonreassuring fetal status as the indication for cesarean delivery among all deliveries (N=36,014) was not significantly associated with time of day (P=.082) (Fig. 2C). Similarly, the frequency of “other” indications for cesarean delivery was also not significantly associated with time of day (P=.123) (Fig. 2D).
Among the study population, 22,566 (62.7%) women presented in spontaneous labor, and 13,448 (37.3%) were induced (Table 1). Even after testing for interactions for whether women were spontaneously laboring or induced, which hospital the women delivered in, or whether the hospital was a teaching or nonteaching institution, we found that the above associations between time of day and decision for cesarean delivery remained (P>.05 for interaction terms). Similarly, whether women labored on a weekday or weekend, we found that temporal variations between time of day and decision for cesarean delivery were seen (Appendix 2, http://links.lww.com/AOG/B732).
DISCUSSION
Among nulliparous women with singleton, nonanomalous gestations in vertex presentation who attempted labor at term, the decision to perform a cesarean delivery became more frequent throughout the day and then subsequently declined at night (Fig. 2A). Additionally, the frequency of cesarean delivery performed for the primary indication of dystocia showed the same temporal pattern (Fig. 2B).
Our findings add to those of prior studies that found that the frequency of intrapartum cesarean delivery varied by time of day. Based on 2013 birth certificate data from the National Vital Statistics System,13 the proportion of births by cesarean delivery during labor generally rose throughout the day, with a peak from 17:00 to 18:59. Another investigator24 also described a “time effect” that was observed at military hospitals, in which women were more likely to have an unplanned cesarean delivery in the evening hours (18:00–20:00) and least likely to have an unplanned cesarean delivery during the early night hours (00:00–03:00). Similarly, Woodhead et al25 found that women who delivered at night (00:00–07:59) were more likely to have a normal delivery and less likely to have obstetric intervention in the form of assisted or operative delivery. However, their data were more limited because birth time was classified into three groups (night, day, and twilight) instead of using time as a continuous measure, as in our analysis. One issue with prior studies is that they examined actual time of cesarean delivery, which may not fully capture the actual variation in when a decision to perform a cesarean delivery is made. Our analysis, in contrast, was able to evaluate the actual documented time when the decision for cesarean delivery was made.
Moreover, we were able to evaluate the primary indication for the cesarean delivery. Our findings suggest that cesarean delivery performed for dystocia, and not for fetal status or other medical complications, drives the temporal variation in the decision to perform cesarean delivery in laboring women. Evans et al26 demonstrate that, although the frequencies of “acute” and “semi-acute” primary cesarean delivery did not vary significantly with time of day, “nonacute” primary cesarean delivery (70% of which were performed for “cephalopelvic disproportion”) were not performed as frequently at night (00:00–08:00). Fraser et al27 found that the rate of cesarean delivery performed for dystocia peaked in the evening (18:00–0:00). Furthermore, when patients were stratified by labor duration, the proportion of cesarean delivery performed for dystocia also peaked among patients whose labor duration was less than 16 hours. Our study extends their findings because we were able to assess detailed information about timing of labor phases and whether the adequacy of these phases varied by time of day.
It is possible that this temporal pattern reflects an underlying circadian biology that predisposes to dystocia when labor begins or continues into certain times of the day. However, we have demonstrated that given thresholds for dystocia are differently used based on time of day, which argues against a purely circadian etiology. It also is possible that the temporal pattern is based on the time when labor inductions are started; however, our findings remained significant even after evaluating the diagnosis of labor dystocia made after labor induction compared with spontaneous labor. We also found a significant pattern regardless of weekday or weekend (when labor induction is less frequent). A previous study performed by Palmer et al23 found that the performance of several quality and safety obstetric measures (maternal puerperal infection, in-hospital perinatal mortality, neonatal injury, and neonatal readmissions within three days of discharge) was significantly worse for deliveries occurring on the weekends when compared with weekdays. However, these investigators did not specifically address mode of delivery or indications for cesarean delivery as a quality measure. Additionally, their analysis was limited to the delivery day, because they did not have information on the time of admission, which did not allow them to investigate the more comprehensive question of the quality of off-hours care in their study.
The strengths of this analysis include the large contemporary cohort and the quality of the data, which were abstracted from each patient’s chart by trained research personnel. Additionally, it is well known there is significant variation in cesarean delivery rates across hospitals,28 and an important strength of this study is that our sample was obtained from 25 hospitals across the United States. There may be concerns about generalizability of the findings because the majority of the participating hospitals were teaching hospitals (22/25), and most also had round-the-clock availability of an in-house obstetric attending (21/25), neonatologist (20/25), and dedicated obstetric anesthesiologist (22/25). However, we believe that this is an important strength of this analysis because, even in such high-resource settings, temporal variations are seen. However, limitations of this analysis also should be noted. First, the Obstetric Care Consensus16 was published after the APEX data accrual period. However, the evidence for these guidelines was accumulated before and during the APEX study period. Furthermore, even if these guidelines had not yet been uniformly adopted, any chosen threshold should be no more likely applied differentially based on time of day. Second, we based the determination of active labor using 5 cm of cervical dilation, although evidence from the Consortium on Safe Labor has suggested using 6 cm as a threshold for active labor.29 Thus, our analyses for arrest of dilation and failed induction differed slightly from definitions in prior literature. Prior works examining failed labor induction have suggested that analyses of labor abnormalities, such as failed induction of labor, are similar whether 5 cm or 6 cm dilation are used.30,31
Our findings suggest that among nulliparous women who attempted vaginal delivery at term, there were temporal differences in the decision to perform an intrapartum cesarean delivery, particularly cesarean delivery performed with labor dystocia as the indication. At least some of the differences in cesarean delivery frequency at each hour appear to be related to differences in labor management. Further work is needed to understand what organizational factors (Particularly shift changes and staffing models) might influence this time variation effect, and to investigate strategies that may reduce systems-based differences in cesarean delivery frequency.
Supplementary Material
Financial Disclosure
Mona Prasad disclosed that her travel to steering committee meetings for study-related events was reimbursed via Ohio State University Research Foundation. The other authors did not report any potential conflicts of interest.
The project described was supported by grants from the Eunice Kennedy Shriver National Institute of Child Health and Human Development (NICHD) [HD21410; HD27869; HD27915; HD27917; HD34116; HD34208; HD36801; HD40500; HD40512; HD40544; HD40545; HD40560; HD40485; HD53097; HD53118] and the National Center for Research Resources [UL1 RR024989; 5UL1 RR025764]. Comments and views of the authors do not necessarily represent views of the NIH.
The authors thank Cynthia Milluzzi, RN, and Joan Moss, RNC, MSN, for protocol development and coordination between clinical research centers, and William A. Grobman, MD, MBA, Elizabeth Thom, PhD, Madeline M. Rice, PhD, Brian M. Mercer, MD, and Catherine Y. Spong, MD, for protocol development and oversight.
Footnotes
See Appendix 1, available online at http://links.lww.com/AOG/B732, for a list of other members of the NICHD MFMU Network.
Presented as a poster at the Society for Maternal-Fetal Medicine’s 38th Annual Pregnancy Meeting, January 29-February 3, 2018, Dallas, Texas.
Each author has confirmed compliance with the journal’s requirements for authorship.
REFERENCES
- 1.Martin JA, Hamilton BE, Osterman MJ, Driscoll AK, Mathews TJ. Births: final data for 2015. Natl Vital Stat Rep 2017;66:1. [PubMed] [Google Scholar]
- 2.Osterman MJ, Martin JA. Trends in low-risk cesarean delivery in the United States, 1990–2013. Natl Vital Stat Rep 2014;63: 1–16. [PubMed] [Google Scholar]
- 3.Rhodes JC, Schoendorf KC, Parker JD. Contribution of excess weight gain during pregnancy and macrosomia to the cesarean delivery rate. Pediatrics 2003;111(5 pt 2):1181–5. [PubMed] [Google Scholar]
- 4.Declercq E, Menacker F, MacDorman M. Rise in no indicated risk primary caesareans in the United States, 1991–2001: cross sectional analysis. BMJ 2005;330:71–2. [DOI] [PMC free article] [PubMed] [Google Scholar]
- 5.Declercq E, Menacker F, MacDorman M. Maternal risk profiles and the primary cesarean rate in the United States, 1991–2002. Am J Public Health 2006;96:867–72. [DOI] [PMC free article] [PubMed] [Google Scholar]
- 6.Reddy UM, Ko CW, Willinger M. Maternal age and the risk of stillbirth throughout pregnancy in the United States. Am J Obstet Gynecol 2006;195:764–70. [DOI] [PubMed] [Google Scholar]
- 7.Gregory KD, Jackson S, Korst L, Fridman M. Cesarean versus vaginal delivery: whose risks? Whose benefits? Am J Perinatol 2012;29:7–18. [DOI] [PubMed] [Google Scholar]
- 8.Webb DA, Culhane J. Time of day variation in rates of obstetric intervention to assist in vaginal delivery. J Epidemiol Community Health 2002;56:577–8. [DOI] [PMC free article] [PubMed] [Google Scholar]
- 9.Gould JB, Qin C, Chavez G. Time of birth and the risk of neonatal death. Obstet Gynecol 2005;106:352–8. [DOI] [PubMed] [Google Scholar]
- 10.Bailit JL, Landon MB, Thom E, Rouse DJ, Spong CY, Varner MW, et al. The MFMU Cesarean Registry: impact of time of day on cesarean complications. Am J Obstet Gynecol 2006; 195:1132–7. [DOI] [PubMed] [Google Scholar]
- 11.Bailit JL, Landon MB, Lai Y, Rouse DJ, Spong CY, Varner MW, et al. Maternal-Fetal Medicine Units Network cesarean registry: impact of shift change on cesarean complications. Am J Obstet Gynecol 2008;198:173.e1–5. [DOI] [PubMed] [Google Scholar]
- 12.Kalogiannidis I, Margioula-Siarkou C, Petousis S, Goutzioulis M, Prapas N, Agorastos T. Infant births during the internal night are at increased risk for operative delivery and NICU admission. Arch Gynecol Obstet 2011;284:65–71. [DOI] [PubMed] [Google Scholar]
- 13.Mathews TJ, Curtin S. When are babies born: morning, noon, or night? Birth certificate data for 2013. NCHS Data Brief 2015; 200. [PubMed] [Google Scholar]
- 14.Grobman WA, Bailit JL, Rice MM, Wapner RJ, Varner MW, Thorp JM Jr, et al. Can differences in obstetric outcomes be explained by differences in the care provided? The MFMU Network APEX study. Am J Obstet Gynecol 2014;211:147.e1–16. [DOI] [PMC free article] [PubMed] [Google Scholar]
- 15.Bailit JL, Grobman WA, Rice MM, Spong CY, Wapner RJ, Varner MW, et al. Risk-adjusted models for adverse obstetric outcomes and variation in risk-adjusted outcomes across hospitals. Am J Obstet Gynecol 2013;209:446.e1–30. [DOI] [PMC free article] [PubMed] [Google Scholar]
- 16.Safe prevention of the primary cesarean delivery. Obstetric Care Consensus No. 1. American College of Obstetricians and Gynecologists. Obstet Gynecol 2014;123:693–711. [DOI] [PubMed] [Google Scholar]
- 17.Simon C, Grobman W. When has an induction failed? Obstet Gynecol 2005;105:705–9. [DOI] [PubMed] [Google Scholar]
- 18.Rouse D, Weiner S, Bloom S, Varner M, Spong C, Ramin S, et al. Failed labor induction: toward an objective diagnosis. Obstet Gynecol 2011;117(2 pt 1):267–72. [DOI] [PMC free article] [PubMed] [Google Scholar]
- 19.Rouse D, Owen J, Hauth J. Criteria for failed labor induction: prospective evaluation of a standardized protocol. Obstet Gynecol 2000;96(5 pt 1):671–7. [DOI] [PubMed] [Google Scholar]
- 20.Rouse D, Weiner S, Bloom S, Varner M, Spong C, Ramin S, et al. Second-stage labor duration in nulliparous women: relationship to maternal and perinatal outcomes. Am J Obstetrics Gynecol 2009;201:357.e1–7. [DOI] [PMC free article] [PubMed] [Google Scholar]
- 21.LeRay C, Audibert F, Goffinet F, Fraser W. When to stop pushing: effects of duration of second-stage expulsive efforts on maternal and neonatal outcomes in nulliparous women with epidural analgesia. Am J Obstetrics Gynecol 2009;201: 361.e1–7. [DOI] [PubMed] [Google Scholar]
- 22.Cheng Y, Hopkins L, Caughey A. How long is too long: does a prolonged second stage of labor in nulliparous women affect maternal and neonatal outcomes? Am J Obstetrics Gynecol 2004;191:933–8. [DOI] [PubMed] [Google Scholar]
- 23.Palmer WL, Bottle A, Aylin P. Association between day of delivery and obstetric outcomes: observational study. BMJ 2015;351:h5774. [DOI] [PMC free article] [PubMed] [Google Scholar]
- 24.Brown HS III. Physician demand for leisure: implications for cesarean section rates. J Health Econ 1996;15:233–42. [DOI] [PubMed] [Google Scholar]
- 25.Woodhead N, Lindow S. Time of birth and delivery outcomes: a retrospective cohort study. J Obstet Gynaecol 2012;32:335–7. [DOI] [PubMed] [Google Scholar]
- 26.Evans MI, Richardson DA, Sholl JS, Johnson BA. Cesarean section. Assessment of the convenience factor. J Reprod Med 1984;29:670–6. [PubMed] [Google Scholar]
- 27.Fraser W, Usher RH, McLean FH, Bossenberry C, Thomson ME, Kramer MS, et al. Temporal variation in rates of cesarean section for dystocia: does convenience play a role? Am J Obstet Gynecol 1987;156:300–4. [DOI] [PubMed] [Google Scholar]
- 28.Kozhimannil KB, Law MR, Virnig BA. Cesarean delivery rates vary tenfold among US hospitals; reducing variation may address quality and cost issues. Health Aff (Millwood) 2013; 32:527–35. [DOI] [PMC free article] [PubMed] [Google Scholar]
- 29.Zhang J, Landy HJ, Branch DW, Burkman R, Haberman S, Gregory KD, et al. Contemporary patterns of spontaneous labor with normal neonatal outcomes. Obstet Gynecol 2010; 116:1281–7. [DOI] [PMC free article] [PubMed] [Google Scholar]
- 30.Grobman WA, Bailit J, Lai Y, Reddy UM, Wapner RJ, Varner MW, et al. Defining failed induction of labor. Am J Obstet Gynecol 2018;218:122.e1–8. [DOI] [PMC free article] [PubMed] [Google Scholar]
- 31.Kawakita T, Reddy UM, Iqbal SN, Landy HJ, Huang CC, Hoffman M, et al. Duration of oxytocin and rupture of the membranes before diagnosing a failed induction of labor. Obstet Gynecol 2016;128:373–80. [DOI] [PMC free article] [PubMed] [Google Scholar]
Associated Data
This section collects any data citations, data availability statements, or supplementary materials included in this article.