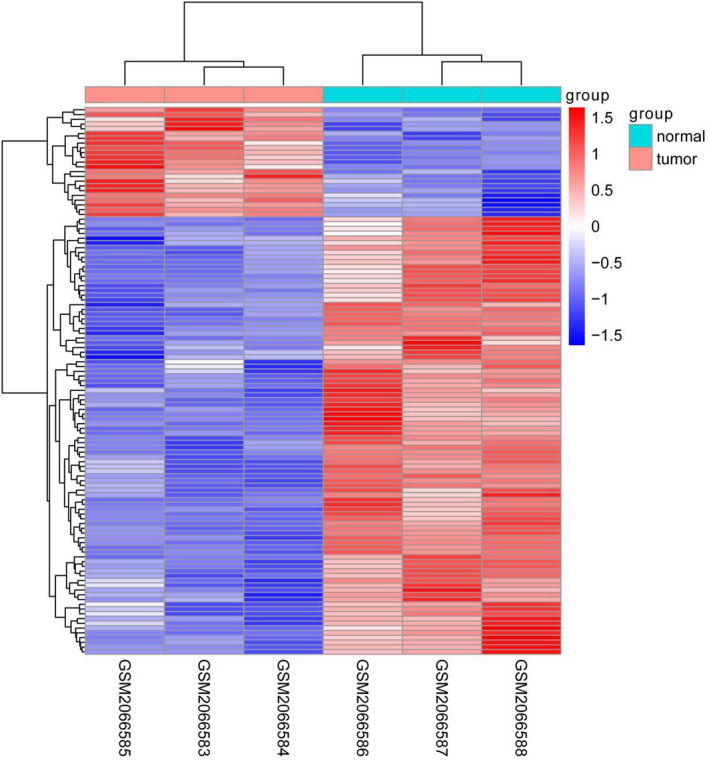
FIGURE 1.

Hierarchical clustering, volcano plots, and scatter plots exhibited the differentially expressed circRNAs in gastric cancer tissues compared with paired non‐gastric cancer tissues

Hierarchical clustering, volcano plots, and scatter plots exhibited the differentially expressed circRNAs in gastric cancer tissues compared with paired non‐gastric cancer tissues