
Figure 1.
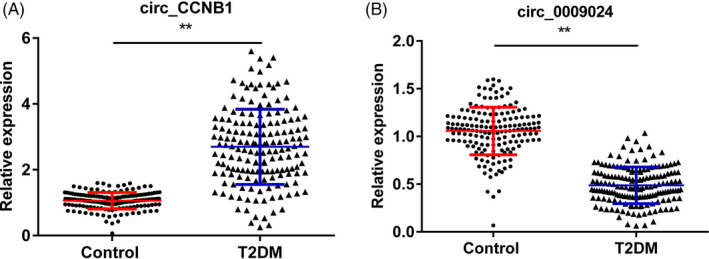
Expressions levels of has_circ_CCNB1 and has_circ_0009024. A, The expression levels of has_circ_CCNB1 in the control and T2DM groups. B, The expression levels of has_circ_0009024 in the control and T2DM groups. ** P < .01, T2DM vs control group. T2DM, type 2 diabetes mellitus; control, healthy volunteers