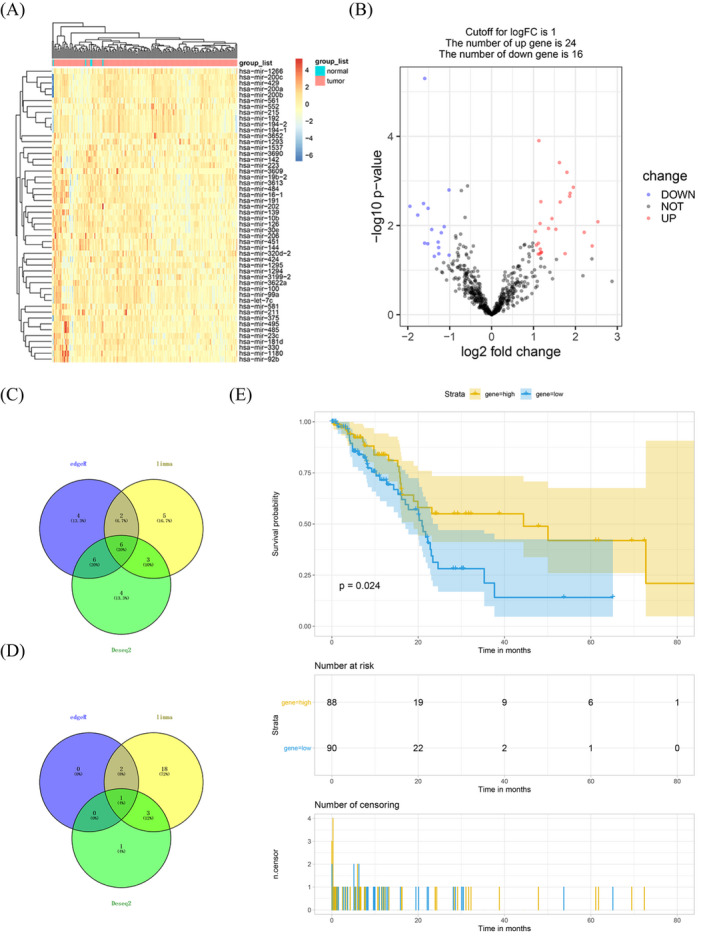
FIGURE 1.

Differentially expressed miRNAs in pancreatic ductal adenocarcinoma. A, Heat maps of the expression levels of the top 50 differentially expressed miRNAs screened by limma. B, Volcano plots of the expression levels of differentially expressed miRNAs by limma. C and D, Venn diagram showed all downregulated and upregulated miRNAs by the three R package. E, Kaplan‐Meier analyzed the correlation between miR‐10b expression levels and the overall survival of patients in The Cancer Genome Atlas
