Figure 1.
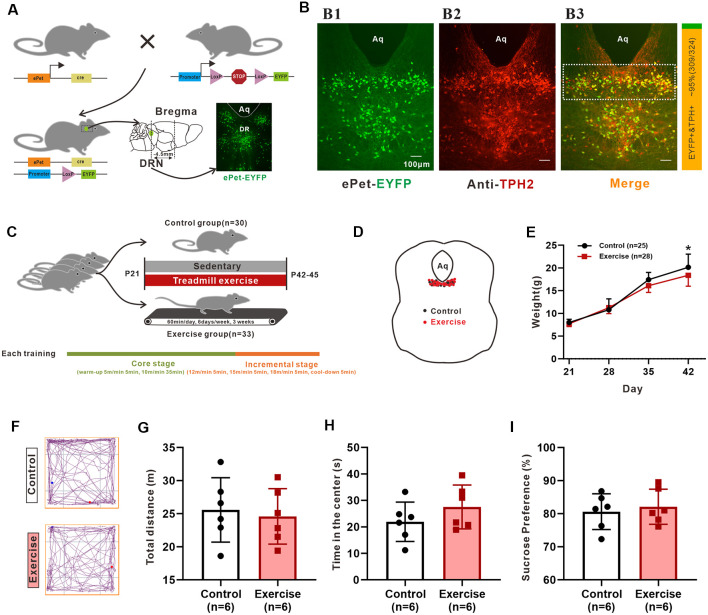
The reliability of animal model and experimental design. (A) Schematic representation of the generation of the transgenic ePet-EYFP mice. The Serotonin (5-HT) neurons in the dorsal raphe nucleus (DRN; about −4.5 mm apart from bregma) were labeled with enhanced yellow fluorescent proteins. (B) Colocalization (B3) of ePet-EYFP (B1) and TPH2 (B2; TPH2 1:200, ab184505, Abcam) in DRN. The ratio of the number of TPH2-labeled EYFP-positive neurons (orange color, double labeling) to the number of EYFP-positive neurons (both green and orange colors) in the DRN (shown as dotted box in B3) were counted manually. The statistical results are shown in a bar chart on the right (about 95%, 309/324, mice: n = 3). (C) Sixty-three mice (P21) were randomly divided into control group and treadmill exercise group. Control group mice remained sedentary (n = 30), and treadmill exercise mice completed 60 min treadmill exercise each day (6 days/week) for a period of 3 weeks (n = 33). Each training session was divided into two stages (core stage and incremental stage). The core stage took a total of 40 min (warm-up 5 m/min for 5 min, 10 m/min for 35 min). The incremental stage took a total of 20 min (12 m/min for 5 min, 15 m/min for 5 min, 18 m/min for 5 min, cool-down for 5 min). (D) Location of neurons patched for electrophysiological and morphological analysis. (E) Weight of control (n = 25) and treadmill exercise group (n = 28) mice at P21, P28, P35, and P42. Three weeks of exercise significantly decreased the body mass of mice (p = 0.036). (F) The representative trajectory maps of each group. There was no significant difference either in total distance (G) or time in the center (H) in the Open-Field Test (OFT; p = 0.715, p = 0.247, respectively). (I) There was no significant difference in sucrose preference (p = 0.638). *p < 0.05.

