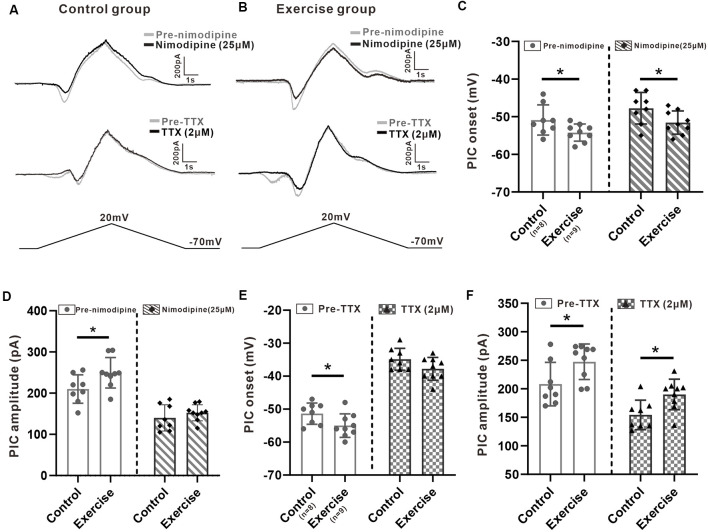
Figure 5.
Effects of treadmill exercise on each component of PICs. (A) Examples of the effects of nimodipine (25 μM, top traces) and TTX (2 μM, middle traces) on PICs in the control group. (B) Examples of the effects of nimodipine (25 μM, top traces) and TTX (2 μM, middle traces) on PICs in the exercise group. (C) Exercise training significantly hyperpolarized the onset of composite PIC (left panel, unpaired Student’s t-test, p = 0.049). Significant difference was also observed in Na-PIC onset between control and exercise groups with nimodipine (right panel, unpaired Student’s t-test, p = 0.049). (D) Exercise training significantly increased the composite PIC amplitude (left panel, unpaired Student’s t-test, p = 0.039). There was no significant difference in Na-PIC amplitude between the control and exercise groups (right panel, unpaired Student’s t-test, p = 0.345). (E) Exercise training significantly hyperpolarized the onset of composite PIC (left panel, unpaired Student’s t-test, composite p = 0.046). There was no significant difference in Ca-PIC onset between the control and exercise groups (right panel, unpaired Student’s t-test, p = 0.098). (F) Exercise training significantly increased the amplitude of composite PIC (left panel, unpaired Student’s t-test, p = 0.034). However, even reduced by TTX, the amplitude of Ca-PIC measured from the exercise group was still bigger than that from the control group (right panel, unpaired Student’s t-test, p = 0.013). *p < 0.05.

