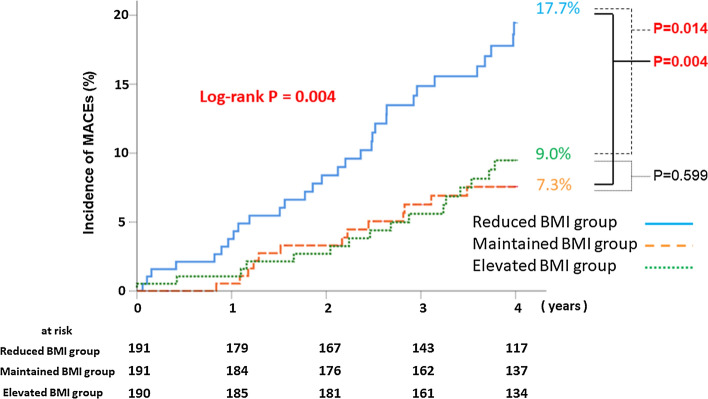
Fig. 2.
Kaplan–Meier analysis for the incidence of MACEs. Incidence of MACEs. The Kaplan–Meier curve for the cumulative incidence of MACEs is shown. MACEs include all-cause mortality, myocardial infarction, and stroke. The reduced BMI group (< − 0.52 kg/m2; n = 191) has a significantly higher incidence of MACEs than the maintained BMI group (− 0.52 to 0.38 kg/m2; n = 191) and elevated BMI group (≥ + 0.38 kg/m2; n = 190). BMI body mass index, MACE major adverse cardiac events

