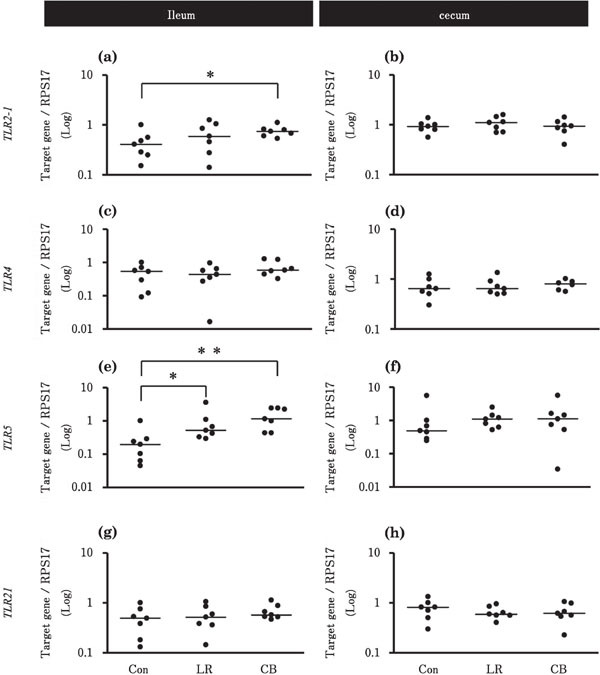
Fig. 1.

Effects of probiotic treatments on the expression levels of TLRs in the chick ileum and cecum. The values are fold changes in gene expression. Chicks in Con, LR, and CB groups were orally administrated with 500 µl deionized water, 2×10⁹ CFU L. reuteri, and 1.3×10⁷ cells C. butyricum, respectively [n=7 in each group, except for TLR4 data for the cecum in the CB group (n=6). The solid bar represents the median value within each group. Asterisks indicate significant differences between the Con group and each probiotic group, determined by Kruskal-Wallis and Steel tests (* P<0.05, ** P<0.01).
