Figure 1.
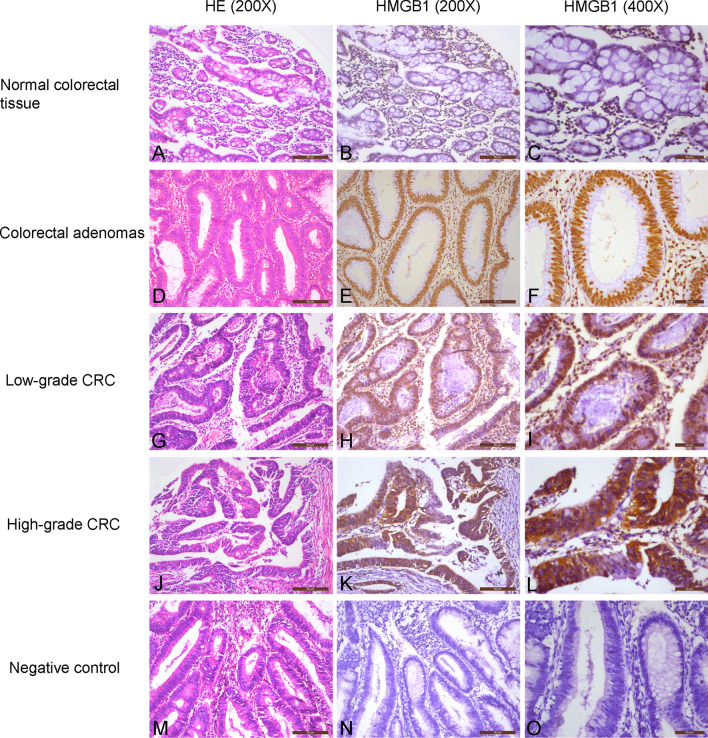
Immunochemical analysis of HMGB1 expression and subcellular localization in colorectal tissue. (A–C) Normal colorectal tissue, not strongly nuclear positive/cytoplasmic negative. (D–F) Colorectal adenomas, strongly nuclear positive/cytoplasmic negative. (G–I) Low-grade CRC, strongly nuclear positive/cytoplasmic negative. (J–L) High-grade CRC, not strongly nuclear positive/cytoplasmic positive. (M–O) Negative control, nuclear negative/cytoplasmic negative.

