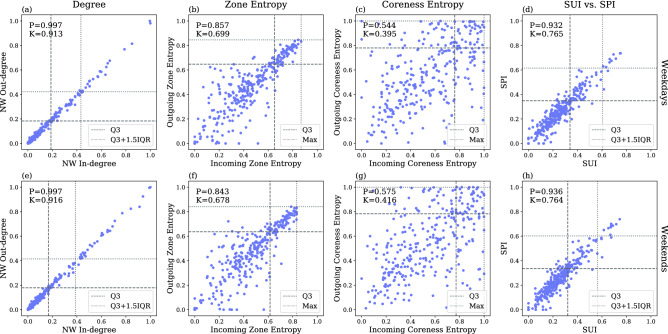
Figure 10.
Comparison between the outgoing and incoming variants of the three components as well the SUI and SPI indexes. x-axis: incoming variant, y-axis: outgoing variant. Top row: weekdays, bottom row: weekends. Starting from left, the first column: normalized weighted degree, second column: zone entropy, third column: coreness entropy, last column: the two indexes SPI and SUI. Correlations between the incoming and outgoing measurements are shown at the top left corner of each subfigure. P Pearson coefficient, K Kendall tau).

