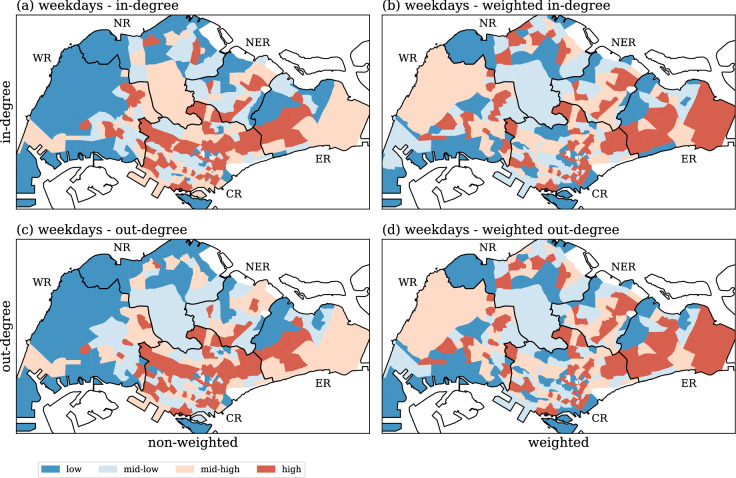
Figure 3.
Spatial distribution of the degree centralities for the weekday dataset. Left column (a,c) shows the distribution for non-weighted measurements and the right column (b,d) shows the distribution for weighted measurements of the degree. The top row (a,b) displays the in-degree, while the bottom row (c,d) refers to the out-degree. The townships are separated into four groups using the 25%, 50% and 75% percentile as breaks, thereby giving the “low”, “mid-low”, “mid-high” and “high” intensities. Generated with Python (3.7.5), Matplotlib (3.2.1) and GeoPandas (0.7.0).

