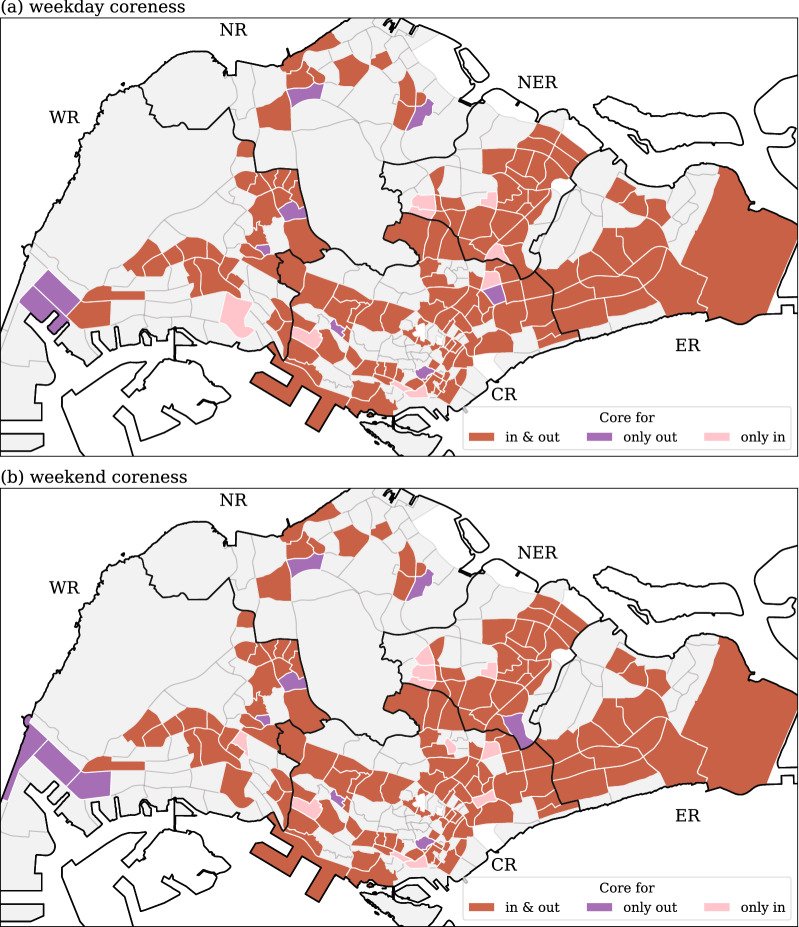
Figure 6.
Distribution of core/non-core areas from the weighted k-shell decomposition. The coreness in (a) refers to weekday flow data, while in (b) it is for weekend flow data. Red-colored areas are for subzones identified as both incoming and outgoing core areas, purple-colored areas refer to solely outgoing core subzones, and pink-colored subzones highlight solely incoming core subzones. Generated with Python (3.7.5), Matplotlib (3.2.1) and GeoPandas (0.7.0).

