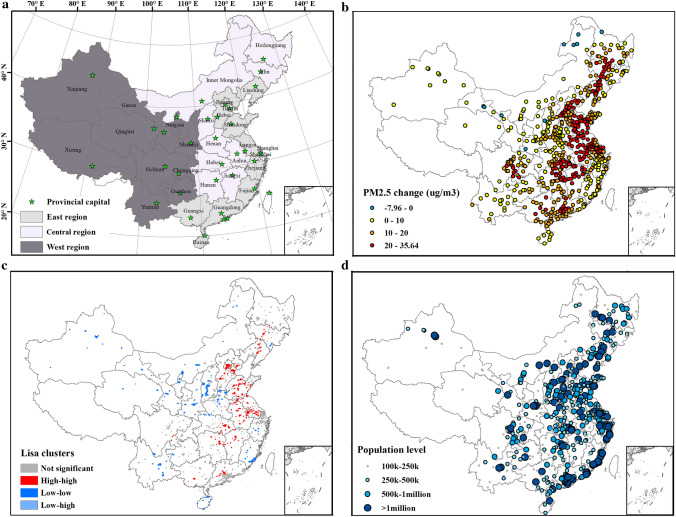
Figure 3.
(a) Division of cities in China by socioeconomic development level and the locations of provincial capitals; (b) Changes in annual mean PM2.5 concentrations between the year 2000 and 2014; (c) LISA cluster maps for PM2.5 changes at the city level; High-high indicates a statistically significant cluster of high PM2.5 level changes over the study period. Low-low indicates a cluster of low PM2.5 inter-annual variation; No high-low cluster is reported; Low–high represents cities with high PM2.5 inter-annual variation surrounded by cities with low variation; (d) Population level by cities in the year 2014. Maps were produced by ArcGIS 10.7.185.

