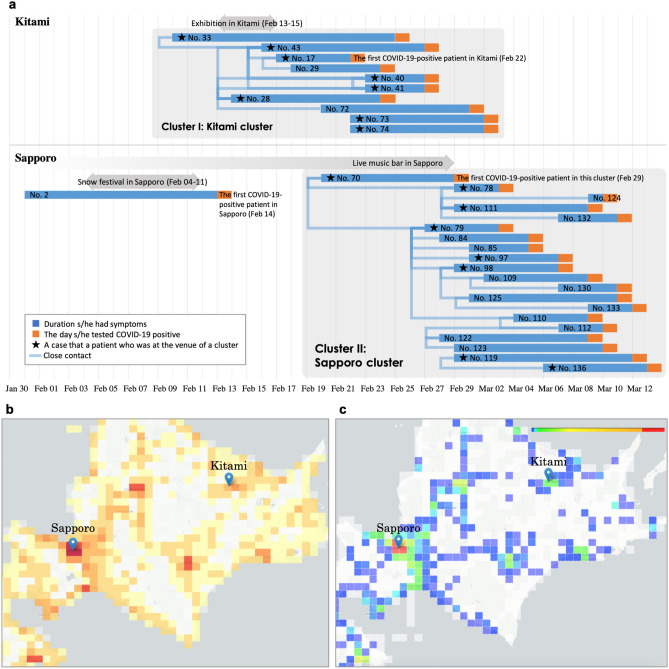
Figure 1.
Occurrence status of the two clusters in Hokkaido, spatial distribution of population, and the total number of WSSCI per half grid (WSSCIphg) in Hokkaido. (a) Timeline of outbreaks of two clusters in Hokkaido, Cluster I: Kitami cluster and Cluster II: Sapporo cluster, based on the Hokkaido government’s official announcement. The existence of the Kitami cluster and Sapporo cluster was admitted on March 9 and March 18, 2020, respectively. (b) Population distribution in Hokkaido. The color scale ranges from red (large) to yellow (small) and white (zero). The blue marker denotes the location of a cluster (Kitami cluster is [43.804878, 143.897225] and Sapporo cluster is [43.068700, 141.350767]). (c) Spatial distribution of the total number of WSSCIphg throughout every 400 half grid squares between January 27 and March 1, 2020. The colors of grid squares represent the total WSSCIphg throughout every 400 half grid squares, of which red is large, blue is small, and white is zero. The blue marker denotes the location of a cluster (Kitami cluster is [43.804878, 143.897225] and Sapporo cluster is [43.068700, 141.350767]).

