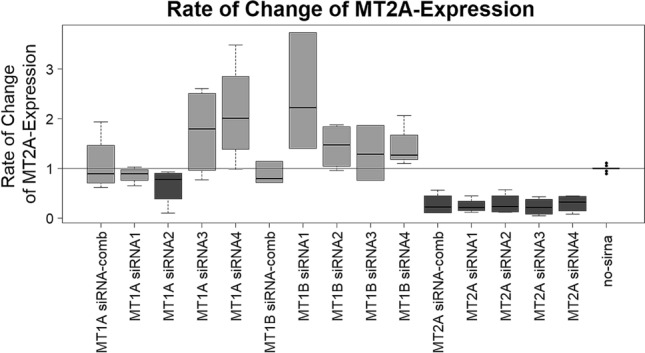
Figure 5.

Rate of change of MT2A expression of all three MPM cell lines tested. As expected, most of siRNAs targeting MT1A and MT1B did not reduce MT2A expression. However, siRNA no. 2 targeting MT1A showed decreased MT2A expression to 80%. Expression of MT2A was reduced to 40–50%. Shapiro-Wilks-test revealed a non-parametric distribution. Therefore, Wilcoxon Mann–Whitney rank sum test was applied. P-values see Table 2. P-values are shown in Table 2.
