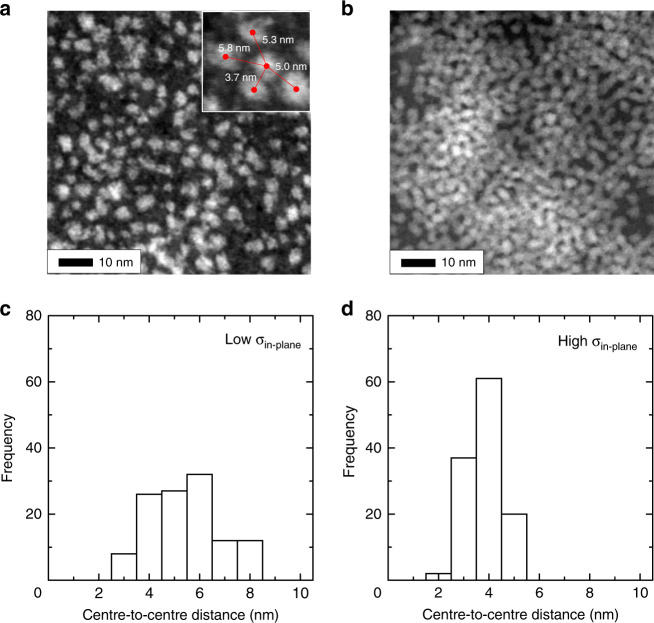
Fig. 3. Scanning transmission electron microscopy images of quantum dot monolayers.
a, b Scanning transmission electron microscopy images of quantum dot monolayers with low a and high b in-plane quantum dot density (σin-plane), which were fabricated with ODsol = 0.02 and 0.15, respectively. The inset in the figure is the enlarged image. The red dots point to the centre of the quantum dots, and the red lines connect the points. The numbers shown in white indicate the length of the red lines, which are centre-to-centre distance between quantum dots. c, d Histograms of the centre-to-centre distances between quantum dots in the quantum dot monolayers with low c and high d σin-plane.

