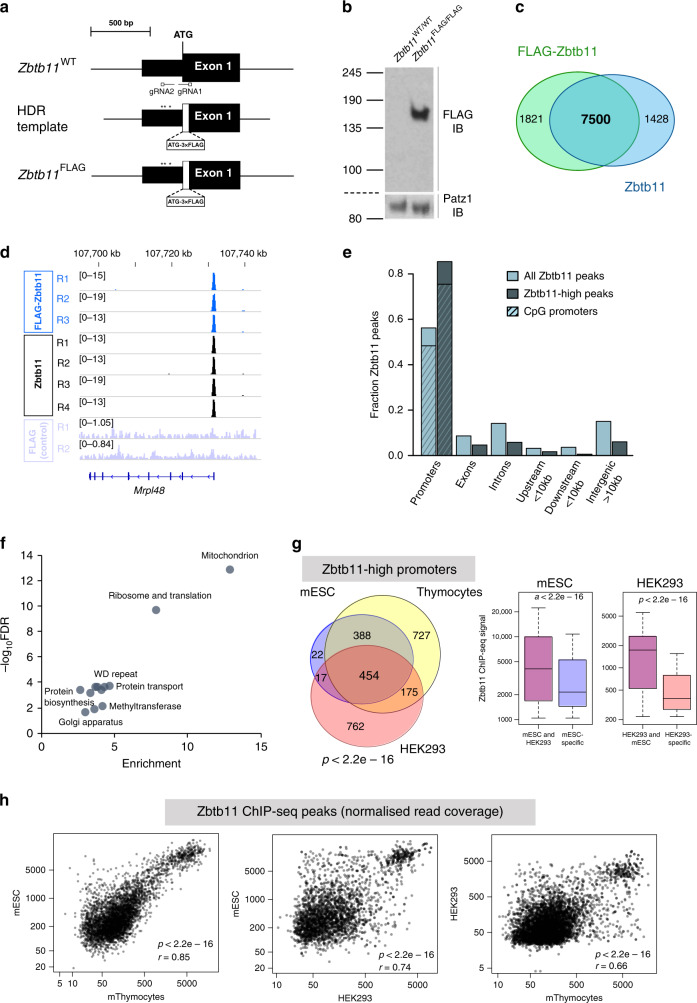
Fig. 1. Zbtb11 is enriched at promoters of nuclear-encoded mitochondrial genes.
a CRISPR/Cas9 ‘knock-in’ approach used to generate the Zbtb11FLAG allele. Two gRNAs targeting the 5′ end of the coding region in the Zbtb11 gene were used in combination with the Cas9 nickase, and a donor template for homology-directed repair (HDR). The donor template contained the 3×FLAG tag immediately downstream of the translation initiating methionine and was protected from Cas9 activity through the substitution of poorly conserved non-coding nucleotides at the gRNA2 site (*), and because the gRNA1 site is disrupted by the 3×FLAG insertion. b Anti-FLAG immunoblot of whole-cell lysates from a Zbtb11FLAG/FLAG homozygous cell line, and the parental line E14 (Zbtb11WT/WT). Patz1 was used as a loading control. Molecular weight marker unit is kDa. Source data are provided as a Source Data file. c Overlap between ChIP-seq peaks for FLAG ChIP in Zbtb11FLAG/FLAG E14 cells, and for ChIP with anti-Zbtb11 antibodies in the parental line E14 (Supplementary Fig. 1c, d). d Example of read coverage at a Zbtb11 target locus (Mrpl48). FLAG ChIP in E14 WT (FLAG control) is shown as background control (Supplementary Fig. 1c, d). e Genome-wide distribution of Zbtb11 peaks with respect to gene features. The distribution of the entire Zbtb11 ChIP-seq dataset is shown alongside that of Zbtb11-high peaks. Within the fraction of peaks found at the promoters, the hatched area indicates the proportion found at CpG island promoters. Source data are provided as a Source Data file. f DAVID functional annotation terms associated with genes that have Zbtb11-high peaks present at their promoters (FDR < 0.05). Plot shows enrichment values vs. significance (−log10 FDR) when compared to all genes in the mouse genome. Source data are provided as a Source Data file. g Venn diagram: conservation of Zbtb11-high peaks at promoters in mESCs, mouse thymocytes and HEK293. The p value for each pairwise hypergeometric test was p < 2.2e−16. Box plots: distribution of Zbtb11 ChIP-seq signal at conserved and cell-type/species-specific peaks, showing that Zbtb11 preferentially binds to conserved peaks. P values are for Wilcoxon’s rank-sum tests. Box plots show the interquartile range (box outline) and median value (horizontal line), with the whiskers delineating the lower and upper limits of the data. Source data are provided as a Source Data file. h Conservation of Zbtb11 binding preference at target promoters, across tissues (left panel, mouse ESCs vs. thymocytes) and species (right panels, mESCs vs. human HEK293 cells, and mouse thymocytes vs. HEK293). Pearson’s correlation coefficients (r) and p values (p) for two-sided correlation tests are shown. Source data are provided as a Source Data file.

