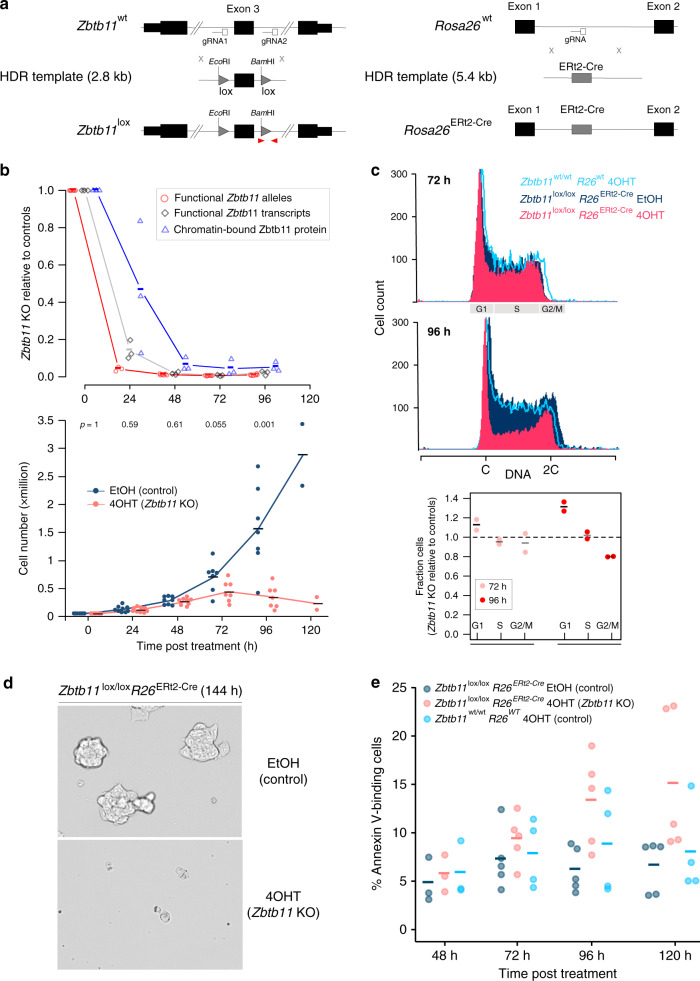
Fig. 2. Zbtb11 is essential for proliferation and cell viability.
a CRISPR ‘knock-in’ strategies used to generate the conditional Zbtb11 KO allele (Zbtb11lox) (left), and to insert the ERt2-Cre transgene in the Rosa26 locus (right). The loxP sites (lox) flanking Zbtb11 exon 3 include ectopic restriction sites (Supplementary Fig. 2a). Red arrowheads mark qPCR primers used to measure the deletion efficiency once ERt2-Cre is activated—recombination between the two loxP sites leads to excision of the left primer binding site along with exon 3, so PCR products are no longer generated. b Time-course experiment describing the dynamics of Zbtb11 inactivation in our inducible Zbtb11 KO ESC line (Zbtb11lox/lox Rosa26ERt2-Cre). Upper panel—decay of functional Zbtb11 alleles (red circles, n = 6 independent experiments, except 24 h timepoint for which n = 3), Zbtb11 transcripts (grey diamonds, n = 3) and protein (blue triangles, n = 3) in 4OHT-treated cells relative to their EtOH-treated control cells following KO induction. Lower panel—growth curves, with p values (two-tailed paired t test) above each timepoint. Source data are provided as a Source Data file. c Propidium iodide stain for cell cycle analysis of control (Zbtb11lox/lox EtOH) and Zbtb11 KO (Zbtb11lox/lox 4OHT) cells. 4OHT-treated Zbtb11wt/wt cells were included to control for potential non-specific effects of 4OHT. Top two panels—representative flow cytometry histograms showing the distribution of DNA content in the sampled cell populations. G1, S or G2/M phases of the cell cycle are indicated on the horizontal axis. Bottom panel—mean and SD of the fractions of 4OHT-treated cells present in each cell cycle phase (normalised to EtOH-treated controls, n = 2). Source data are provided as a Source Data file. d Bright field microscopy images of 144 h Zbtb11 KO and control cells, illustrating the collapse of the culture 6 days after inducing Zbtb11 KO. e Quantification of cell death after Zbtb11 KO induction with FITC-coupled Annexin V. The fraction of Annexin V-positive cells is shown for n = 3 (48 h), n = 5 (72, 96 and 120 h) independent experiments (Supplementary Figs. 2d,9). Source data are provided as a Source Data file.

